- The US remains locked in very slow medium and long-term growth – particularly in terms of per capita GDP growth.
- Due to extremely weak growth of the US economy in 2016 a purely short-term cyclical upturn is likely in 2017 – but any such short-term cyclical upturn will be far too weak to break out of this fundamental medium and long-term trend of US slow growth.
This article analyses these economic trends in detail, considers some of their geopolitical consequences for China and their impact on domestic US politics.
US GDP and per capita GDP growth
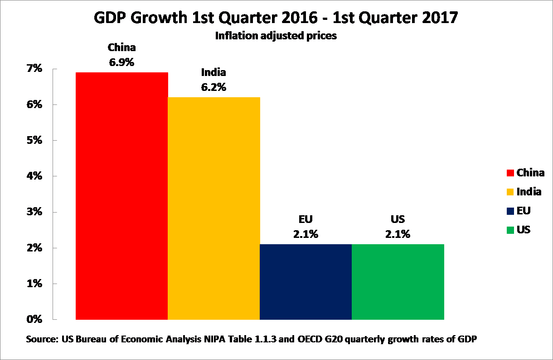
In the 1st quarter of 2017 US GDP was 2.1% higher than in the first quarter of 2016. Making an international comparison to other major economic centres:
- US total GDP growth of 2.1% was the same as the EU’s 2.1%.
- Making a comparison to the largest developing economies, US 2.1% growth was far lower than China’s 6.9% or India’s 6.2%.
This data is shown in Figure 1.
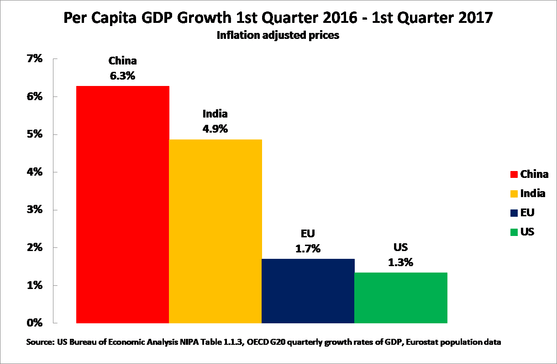
However, in terms of per capita GDP growth the US was the worst performing of the major international economic centres, because the US has faster population growth than any of these except India. US annual population growth is 0.7%, compared to 0.6% in China and 0.4% in the EU – India’s is 1.3%. The result therefore, as Figure 2 shows, is that US per capita GDP growth in the year to the 1st quarter of 2017 was only 1.3% compared to the EU’s 1.7%, India’s 4.9% and China’s 6.3%.
In summary US per capita GDP growth is very weak – only slightly above 1%.
Figure 1
Business cycle
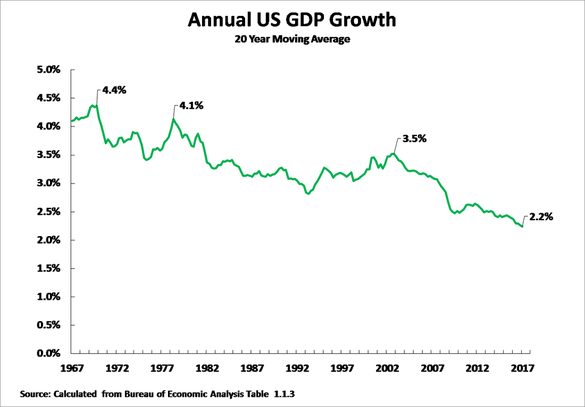
In order to accurately evaluate the significance of this latest US data it is necessary to separate purely business cycle trends from medium/long term ones – as market economies are cyclical in nature failure to separate cyclical trends from long term ones may result in seriously distorted assessments. Purely cyclical effects may be removed by using a sufficiently long term moving average that cyclical fluctuations become averaged out and the long term structural growth rate is shown. Figure 3 therefore shows annual average US GDP growth using a 20-year moving average – a comparison to shorter term periods is given below.
Figure 3 clearly shows that the fundamental trend of the US economy is long-term slowdown. Annual average US growth fell from 4.4% in 1969, to 4.1% in 1978, to 3.2% in 2002, to 2.2% by 1st quarter 2017. The latest US GDP growth of 2.1% clearly does not represent a break with this long-term US economic slowdown but is in line with it.
Cycle and trend
Turning from long term trends to analysis of the current US business cycle, it may be noted that a 5-year moving average of annual US GDP growth is 2.0%, a 7-year moving average 2.1% and the 20-year moving average 2.2%. Leaving aside a 10-year moving average, which is greatly statistically affected by the severe recession of 2009 and therefore yields a result out of line with other measures of average annual growth of only 1.4%, US average annual GDP growth may therefore be taken as around 2% or slightly above. That is, fundamental structural factors in the US economy create a medium/long term growth rate of 2.0% or slightly above. Business cycle fluctuations then take purely short-term growth above or below this average. To analyse accurately the present situation of the US business cycle therefore recent growth must be compared with this long-term trend.
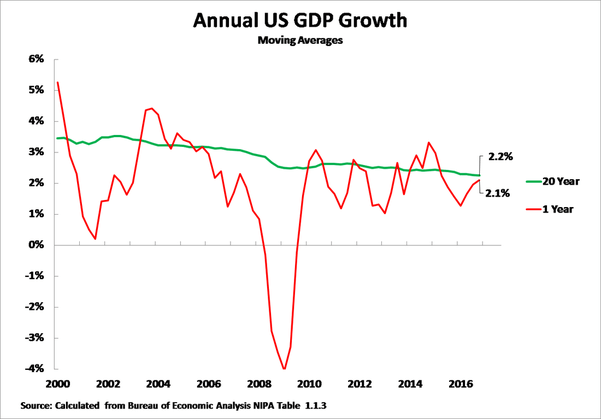
Figure 4 therefore shows the 20-year moving average for US GDP growth together with the year on year US growth rate. This shows that in 2016 US GDP growth was severely depressed – GDP growth in the whole year 2016 was only 1.6% and year on year growth fell to 1.3% in the second quarter. By the 1st quarter of 2017 US year on year GDP growth had only risen to 2.1% – still below the 20-year moving average.
As US economic growth in 2016 was substantially below average a process of ‘reversion to the mean’, that is a tendency to correct exceptionally slow or exceptionally rapid growth in one period by upward or downward adjustments to growth in succeeding periods, would be expected to lead to a short-term increase in US growth compared to low points in 2016. This would be purely for statistical reasons and not represent any increase in underlying or medium/long US term growth. This normal statistical process is confirmed by the acceleration in US GDP growth since the low point of 1.3% in the 2nd quarter 2016 – growth accelerating to 1.7% in 3rd quarter 2016, 2.0% in 4th quarter 2016 and 2.1% in 1st quarter 2017.
Given the very depressed situation of the US economy in 2016 therefore some increase in speed of growth may be expected in 2017 for purely statistical reasons connected to the business cycle.
The economic and domestic US political conclusions of the trends shown in the latest US data are therefore clear
- US economic growth in 2016 at 1.6% was so depressed below even its long term average that some moderate upturn in 2017 is likely. President Trump’s administration may of course claim ‘credit’ for the likely short-term acceleration in US growth in 2017 but any such short-term shift is merely a normal statistical process and would not represent any acceleration in underlying US growth. Only if growth continued sufficiently strongly and for a sufficiently long period to raise the medium/long term rate average could it be considered that any substantial increase in underlying US economic growth was occurring.
- This fall of US per capita GDP growth to a low level clearly has major political implications within the US and underlies recent domestic political events. Very low US per capita growth, accompanied by increasing economic inequality, has resulted in US median wages remaining below their 1999 level – this prolonged stagnation of US incomes explaining recent intense political disturbances in the US around the sweeping aside of the Republican Party establishment by Trump, the strong support given to a candidate for president declaring himself to be a socialist Sanders, current sharp clashes among the US political establishment etc.
- Even a short-term cyclical upturn in the US economy, however, is likely to be translated into increased economic confidence by US voters. This may give some protection to Trump despite current sharp political clashes in the US with numerous Congressional investigations of President related issues and virtually open campaigns by mass media such as the New York Times and CNN to remove the President. The latest opinion poll for the Wall Street Journal showed that men believed the economy had improved since the Presidential election by 74% to 25%, while women believed by 49% to 48% that the economic situation had not improved.
In terms of geopolitical consequences affecting China:
- The short term moderate cyclical upturn in the US economy which is likely in 2017 will aid China’s short term economic growth – particularly as it is likely to by synchronised with a moderate cyclical upturn in the EU. Both trends aid China’s exports
- Nevertheless, due to the very low medium and long-term US growth rate the US will not be able to play the role of economic locomotive of the G20. In addition to economic fundamentals IMF projections are that in the next five years China’s contribution to world growth will be substantially higher than the US. It is therefore crucial China continues to push for economic progress via the G20 and China has the objective possibility to play a leading role in this.
- Very slow growth in the US in the medium and longer term creates a permanent temptation to the US political establishment to attempt to divert attention from this by reckless military action or ‘China bashing’. China’s foreign policy initiatives to seek the best possible relations with the US are extremely correct but the risks from such negative trends in the US situation, and therefore of sharp turns in US foreign policy, must also be assessed.
To keep this article short only a factual summary of the key recent trends within the US economy are given here. A detailed analysis of why the US remains locked in slow medium and long term economic growth is given in my article ‘Why the US economy remains locked in slow growth’. A long term historical analysis of US growth and its relation to economic growth theory may be found in my book The Great Chess Game (一盘大棋? ——中国新命运解析).
Some Chinese media reported US GDP growth in 1st quarter 2017 as 1.4%. This reflects the way the US Bureau of Economic Analysis presents the data – ‘ ‘Real gross domestic product (GDP) increased at an annual rate of 1.4 percent in the first quarter of 2017’ But it is not sufficiently widely understood that US GDP data is presented in a different way to China’s data.
US data in the above form is presented as the percentage growth between one quarter and the next on an annualised basis. That is, the new US data in that form is presented as the growth of 1st quarter 2017 compared to 4th quarter 2016 presented on an annualised basis. Actual US GDP growth between 4th quarter 2016 and 1st quarter 2017 was 0.35% on a seasonally adjusted basis – 1.4% on an annualised basis.
China however emphases presentation of GDP growth year on year growth – China’s GDP growth of 6.9% in 1st quarter 2017 was the change compared to 1st quarter 2016.
What may appear a technical issue has considerable significance due to a serious and known problem in the US data. The US method has the disadvantage that for accurate data the seasonal adjustment between quarters must be correct – different quarters of the year have features which strongly speed or slow growth in that period. But as is widely known among Western analysts the seasonal adjustment in US data for the 1st quarter of the year is inaccurate as it understates growth – the US statistical authorities are aware of this but have not so far succeeded in resolving the problem. To avoid this, it is better to use the system of comparing the 1st quarter of 2017 with the 1st quarter of 2016 – as this automatically avoids the need for seasonal adjustment. On that basis US year on year GDP growth was 2.1% not 1.4%. In order to avoid understating US growth this 2.1% is used in this article.


