The cost of living crisis, due to rapidly rising inflation, is hitting the people of numerous countries. The US is attempting to claim the cause of this is the war in Ukraine. This is a straightforward lie as is easily demonstrated. The huge inflationary wave started, and mainly developed, long before the war started. The inflation is due to the disastrous policies adopted by the US to deal with the Covid created economic crisis in the US. This in turn is due to the capitalist nature of the US economy. This article, which was oringinally published in Chinese by Guancha.cn, analyses the real reasons for the development of this stagflation which is now destabilising both the world economy and world politics.
* * *
The world economic situation Is sharply deteriorating with simultaneously slowing growth and rising inflation – that is the elements of international “stagflation” are appearing. This will inevitably be globally destabilising both economically and politically and China will be under pressure from these international trends.
The U.S. is attempting to claim that these worsening tendencies, including its own economic slowdown and high inflation, are fundamentally due to the Ukraine war. But even a brief examination of the facts shows this is false – the U.S. economy was slowing, and its inflation rising, well before the Ukraine war started. War in Ukraine merely made somewhat worse trends which were already well underway. As will be seen, these strongly negative and destabilising trends in the world economy were “Made in the USA” not “Made in Ukraine”.
Faced with these unfavourable trends it is:
- First, crucial to analyse what is causing them.
- Second, particularly as China will have to respond to these international tendencies with at least moderate stimulus measures, it is necessary to understand the reasons for the serious errors in U.S. economic policy.
As will be seen these two issues have the same cause – the fundamentally wrong policies adopted by the U.S. to deal with the economic consequences of the Covid pandemic and the way these have destabilised both its own and the global economies. It is therefore important for China to learn the lessons of this.
Present negative international economic trends were not primarily created by the Ukraine war
First, to understand both U.S. domestic and global trends, it is necessary to immediately remove the false claim by the U.S. that the worsening international economic situation is due primarily to the Ukraine war. This is easily done simply by looking at chronology. The Ukraine war started on 24 February. But the new and most striking feature of the global situation, the rapidly rising inflation which is accompanying slowing growth, was appearing well before the war began.
U.S. consumer price inflation rose from 2.5% in January 2020 to 7.5% in January 2022 – that is before the Ukraine war began. Over 80% of the current increase in U.S. consumer prices took place before the war. Eurozone inflation followed U.S. price rises, if less sharply, in the same period from January 2020 to January 2022 – rising from 1.4% to 5.1%.
In short, inflation was already rising rapidly in the U.S., and to a lesser extent in Europe, for two years before the war in Ukraine started. The war made the situation somewhat worse, but it did not create the fundamental trend and the largest part of the inflationary shock took place before the war. What, therefore, created this huge inflationary wave? As will be seen, and as was already noted, this inflationary wave was made in the U.S. and not in Ukraine.
Having shown clearly that the claim by the U.S. that rapidly rising inflation was primarily due to the Ukraine war will not stand up to factual examination the real reasons for this inflationary wave in the U.S. and internationally will now be analysed.
The character of the U.S. stimulus programmes
The answer as to what created this huge inflationary wave lies in the type of stimulus programmes launched by the U.S.to counter the economic downturn created by the Covid19 pandemic. These were characterised by a focus on stimulating consumption, by huge budget deficits funded by massive borrowing, and large scale expansion of the money supply.
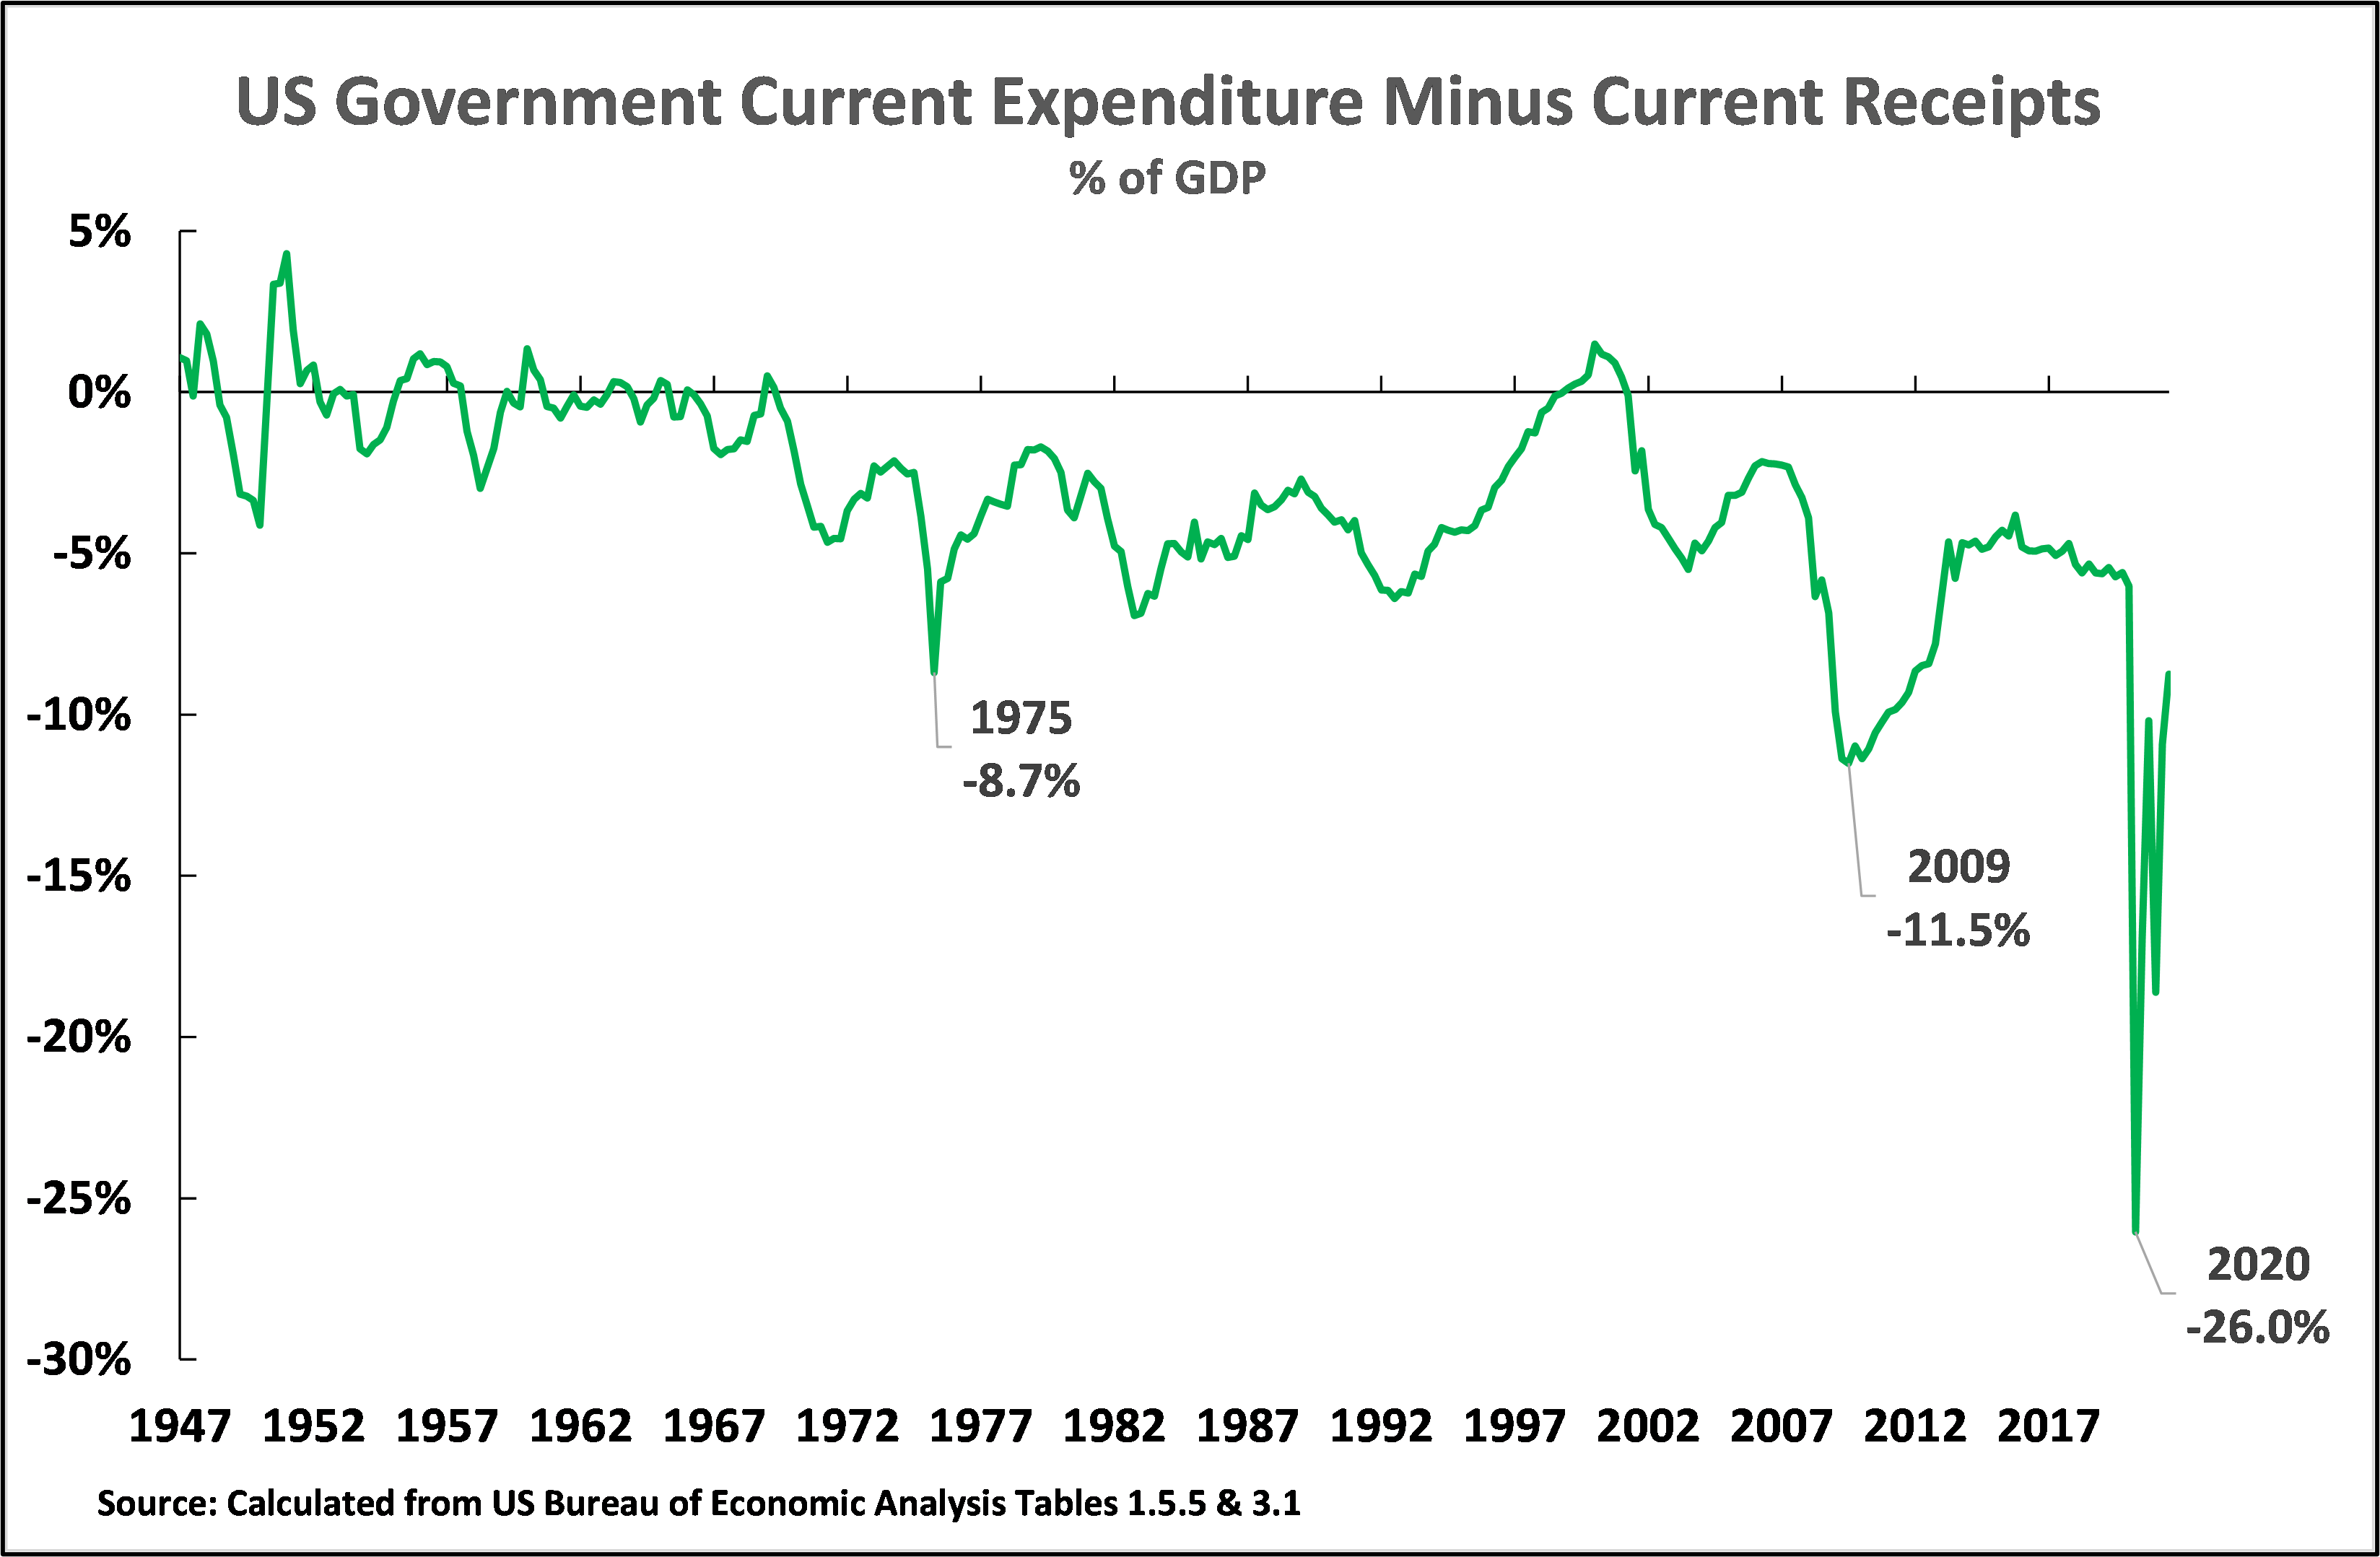
Starting with the budget deficit, as shown in Figure 1, the deficit on U.S. government current expenditure compared to its current receipts rose to 26.0% of GDP in the second quarter of 2020 – by far the highest level in U.S. peacetime history. For comparison this was three times the level of the difference between U.S. government expenditure and receipts during the international financial crisis after 2007, and more than three times that during the U.S. response to the oil price increase of the early 1970s.
Figure 1
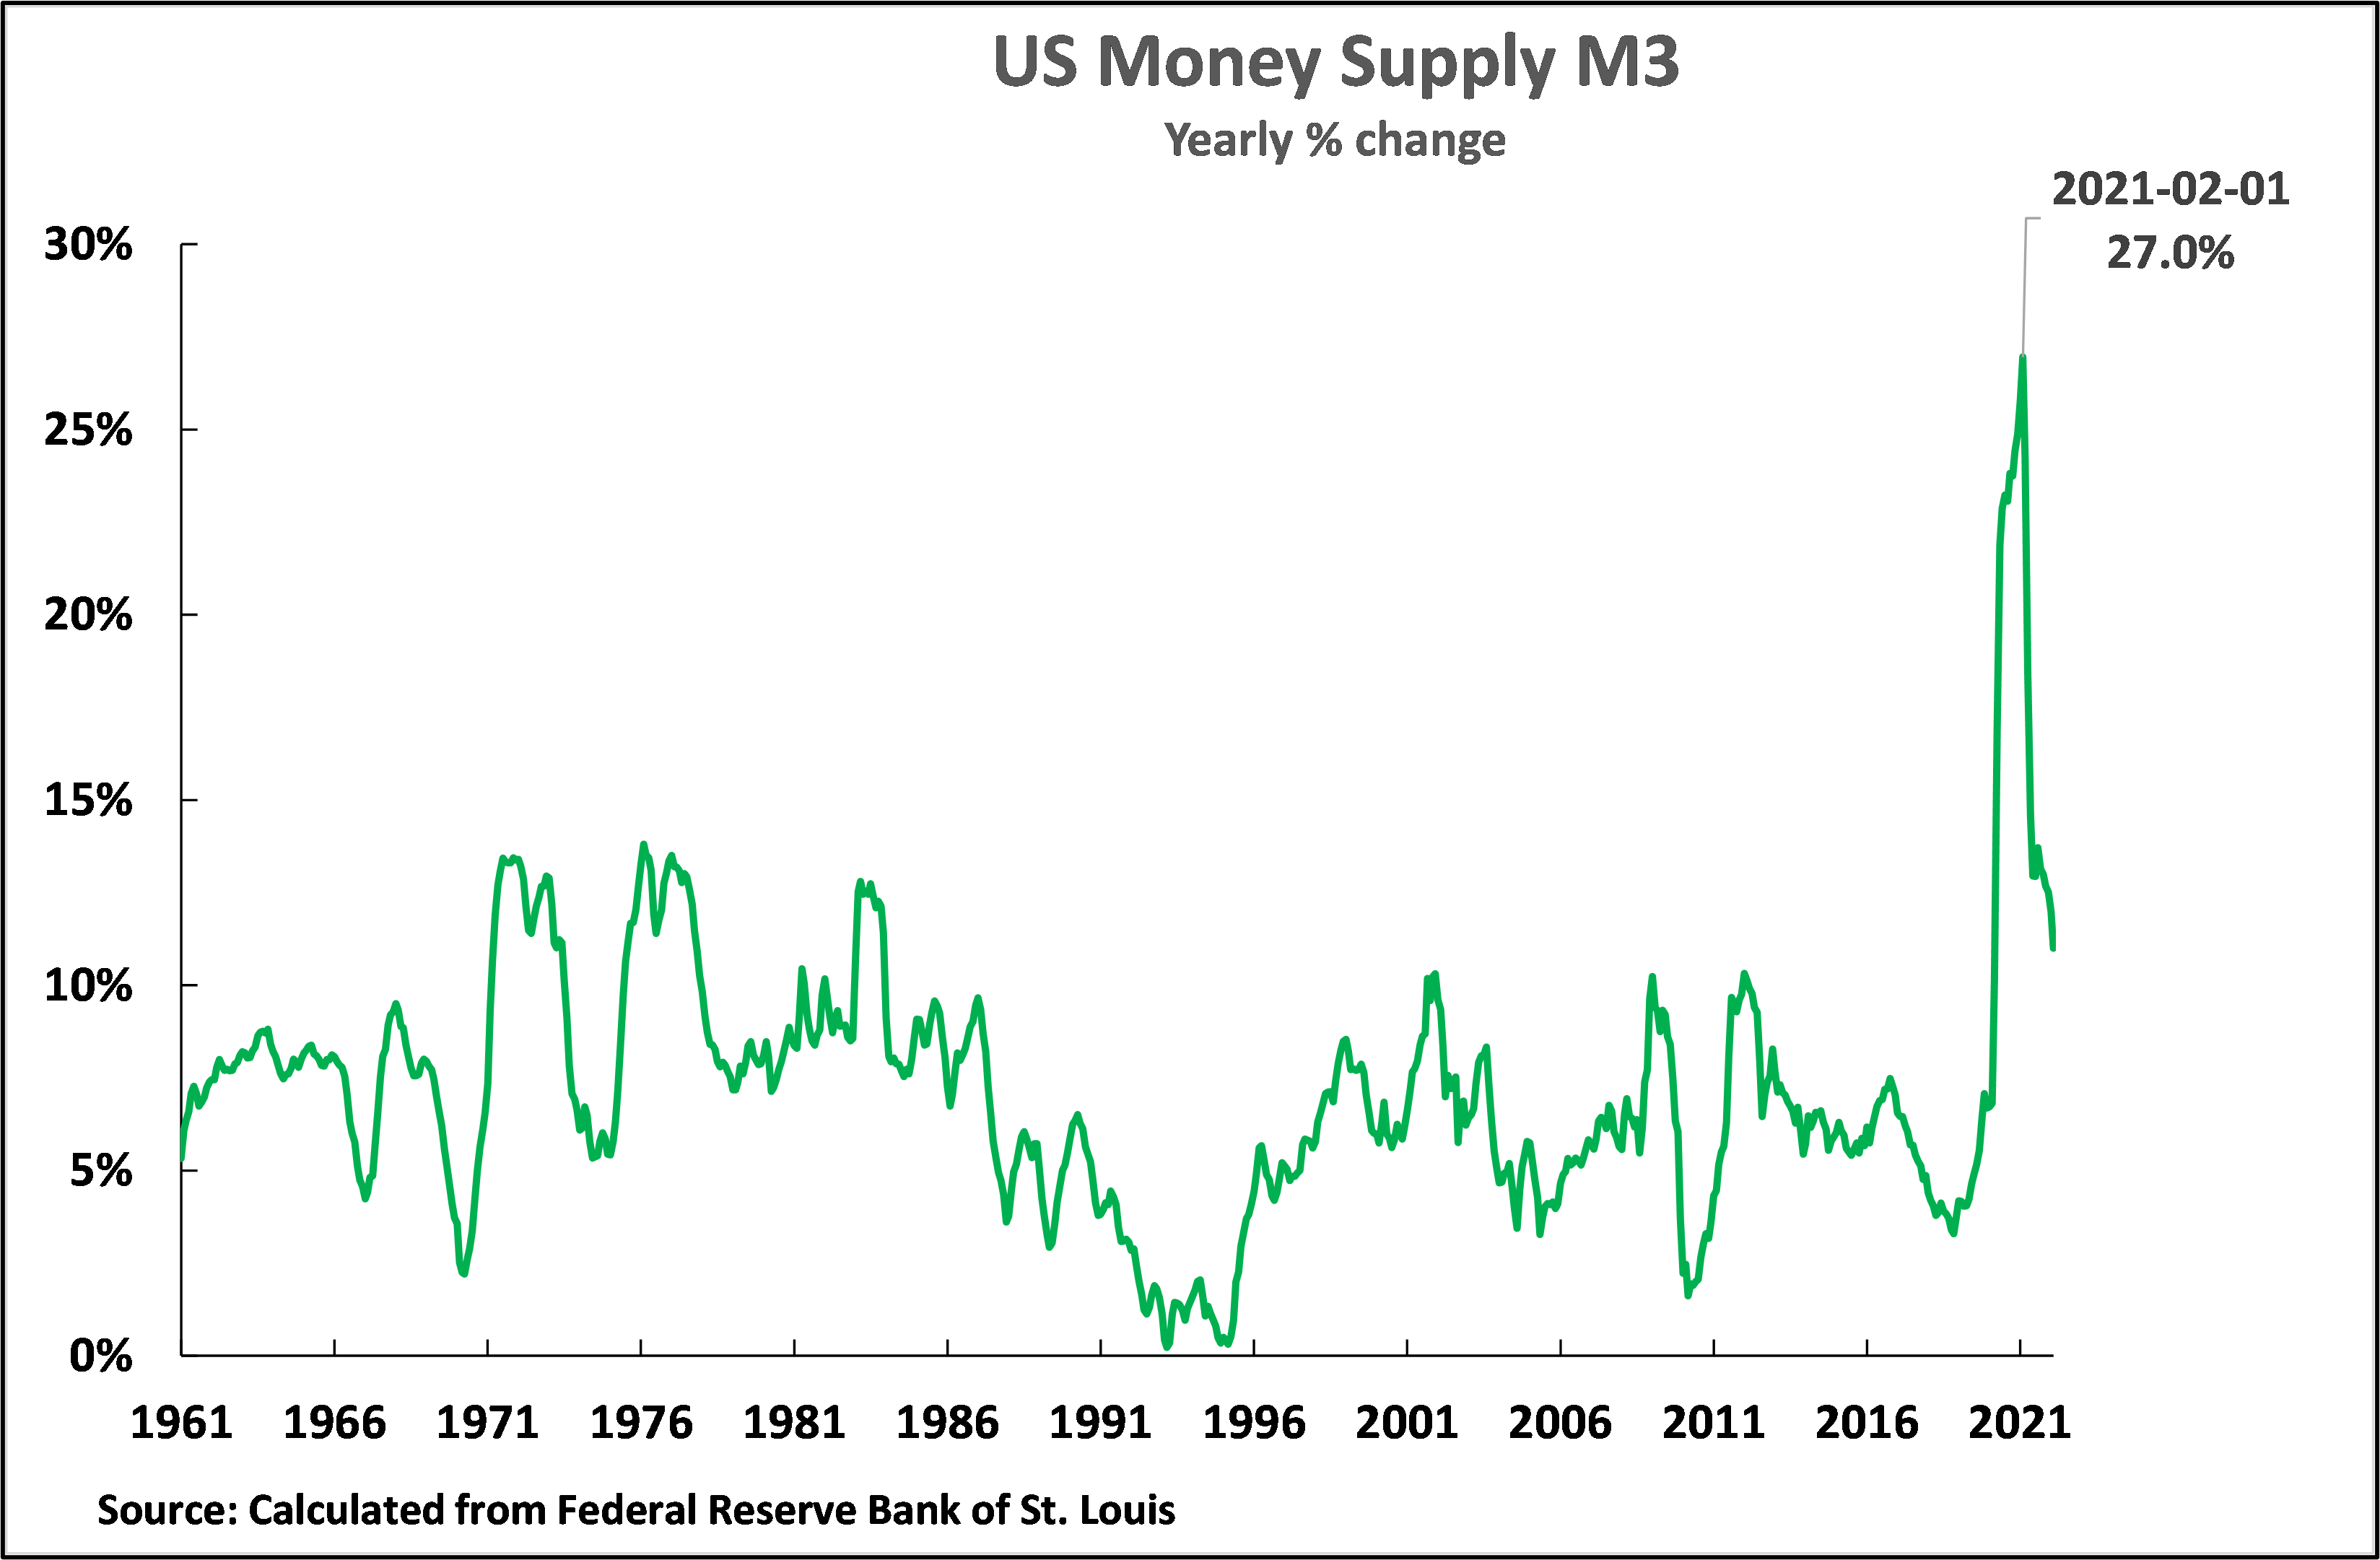
This enormous increase in the U.S. budget deficit was accompanied by an equally unparalleled peacetime increase in the U.S. money supply. As shown in Figure 2 in February 2021 the annual increase in the U.S. M3 money supply rose to 27.1% -completely unprecedented in U.S. history for at least the last 60 years for which data is available, and almost certainly far longer.
Figure 2
The character of the present U.S. stimulus package
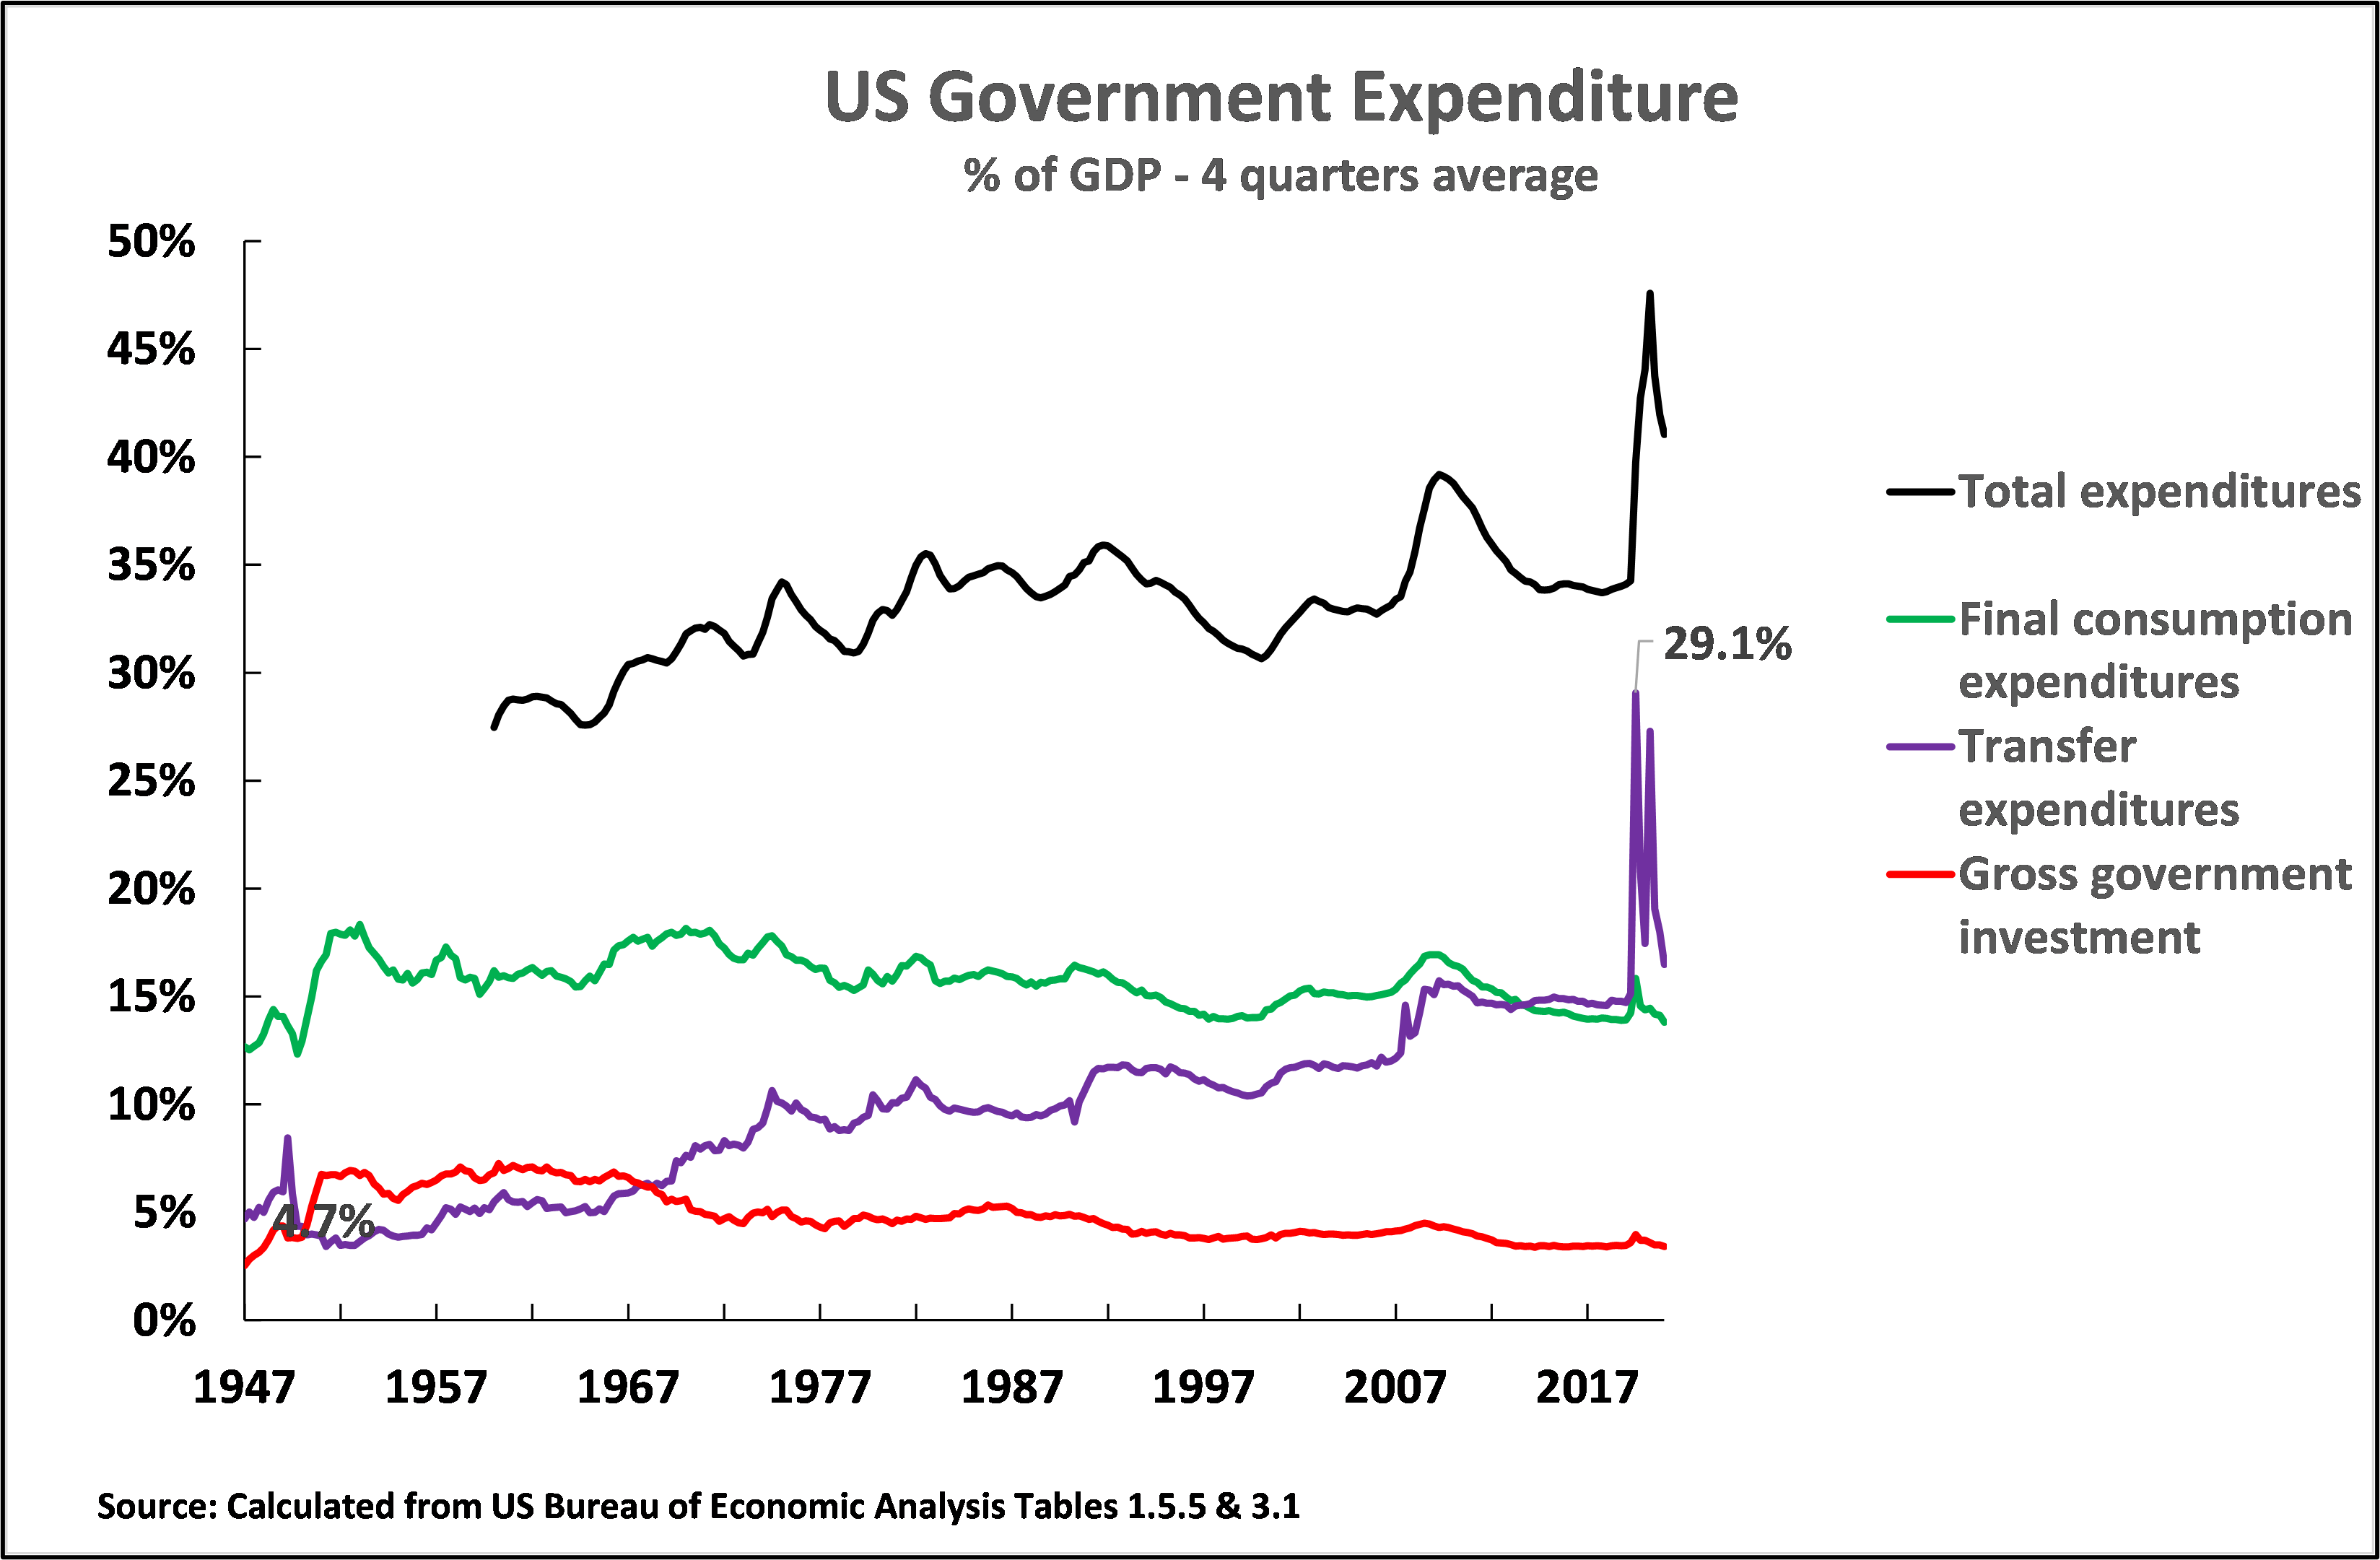
Turning to the character of the U.S. fiscal stimulus packages launched since the beginning of the Covid pandemic their fundamental features are shown in Figure 3. As may be seen, almost all the huge increase in U.S. government expenditure in these stimulus packages was in “transfer payments” – that is state payments to individuals such as for compensation to employees for loss of income due to companies’ shutdowns caused by Covid, for state financed unemployment pay, for state pensions etc. Such payments reached an astonishing 29.1% of GDP in the 2nd quarter of 2020, almost twice the level of the 14.7% of GDP in the 4th quarter of 2019 before Covid struck. Such payments are neither directly investment nor final government consumption (education, health etc) but payments of welfare benefits.
As may be seen from Figure 3 In contrast to such transfer payments, as a percentage of GDP, government final consumption expenditure (education, health, military spending) did not rise significantly, nor did government investment. As the overwhelming bulk of the these transfer payments were made to individuals they were primarily used for consumption – as will be seen.
Figure 3
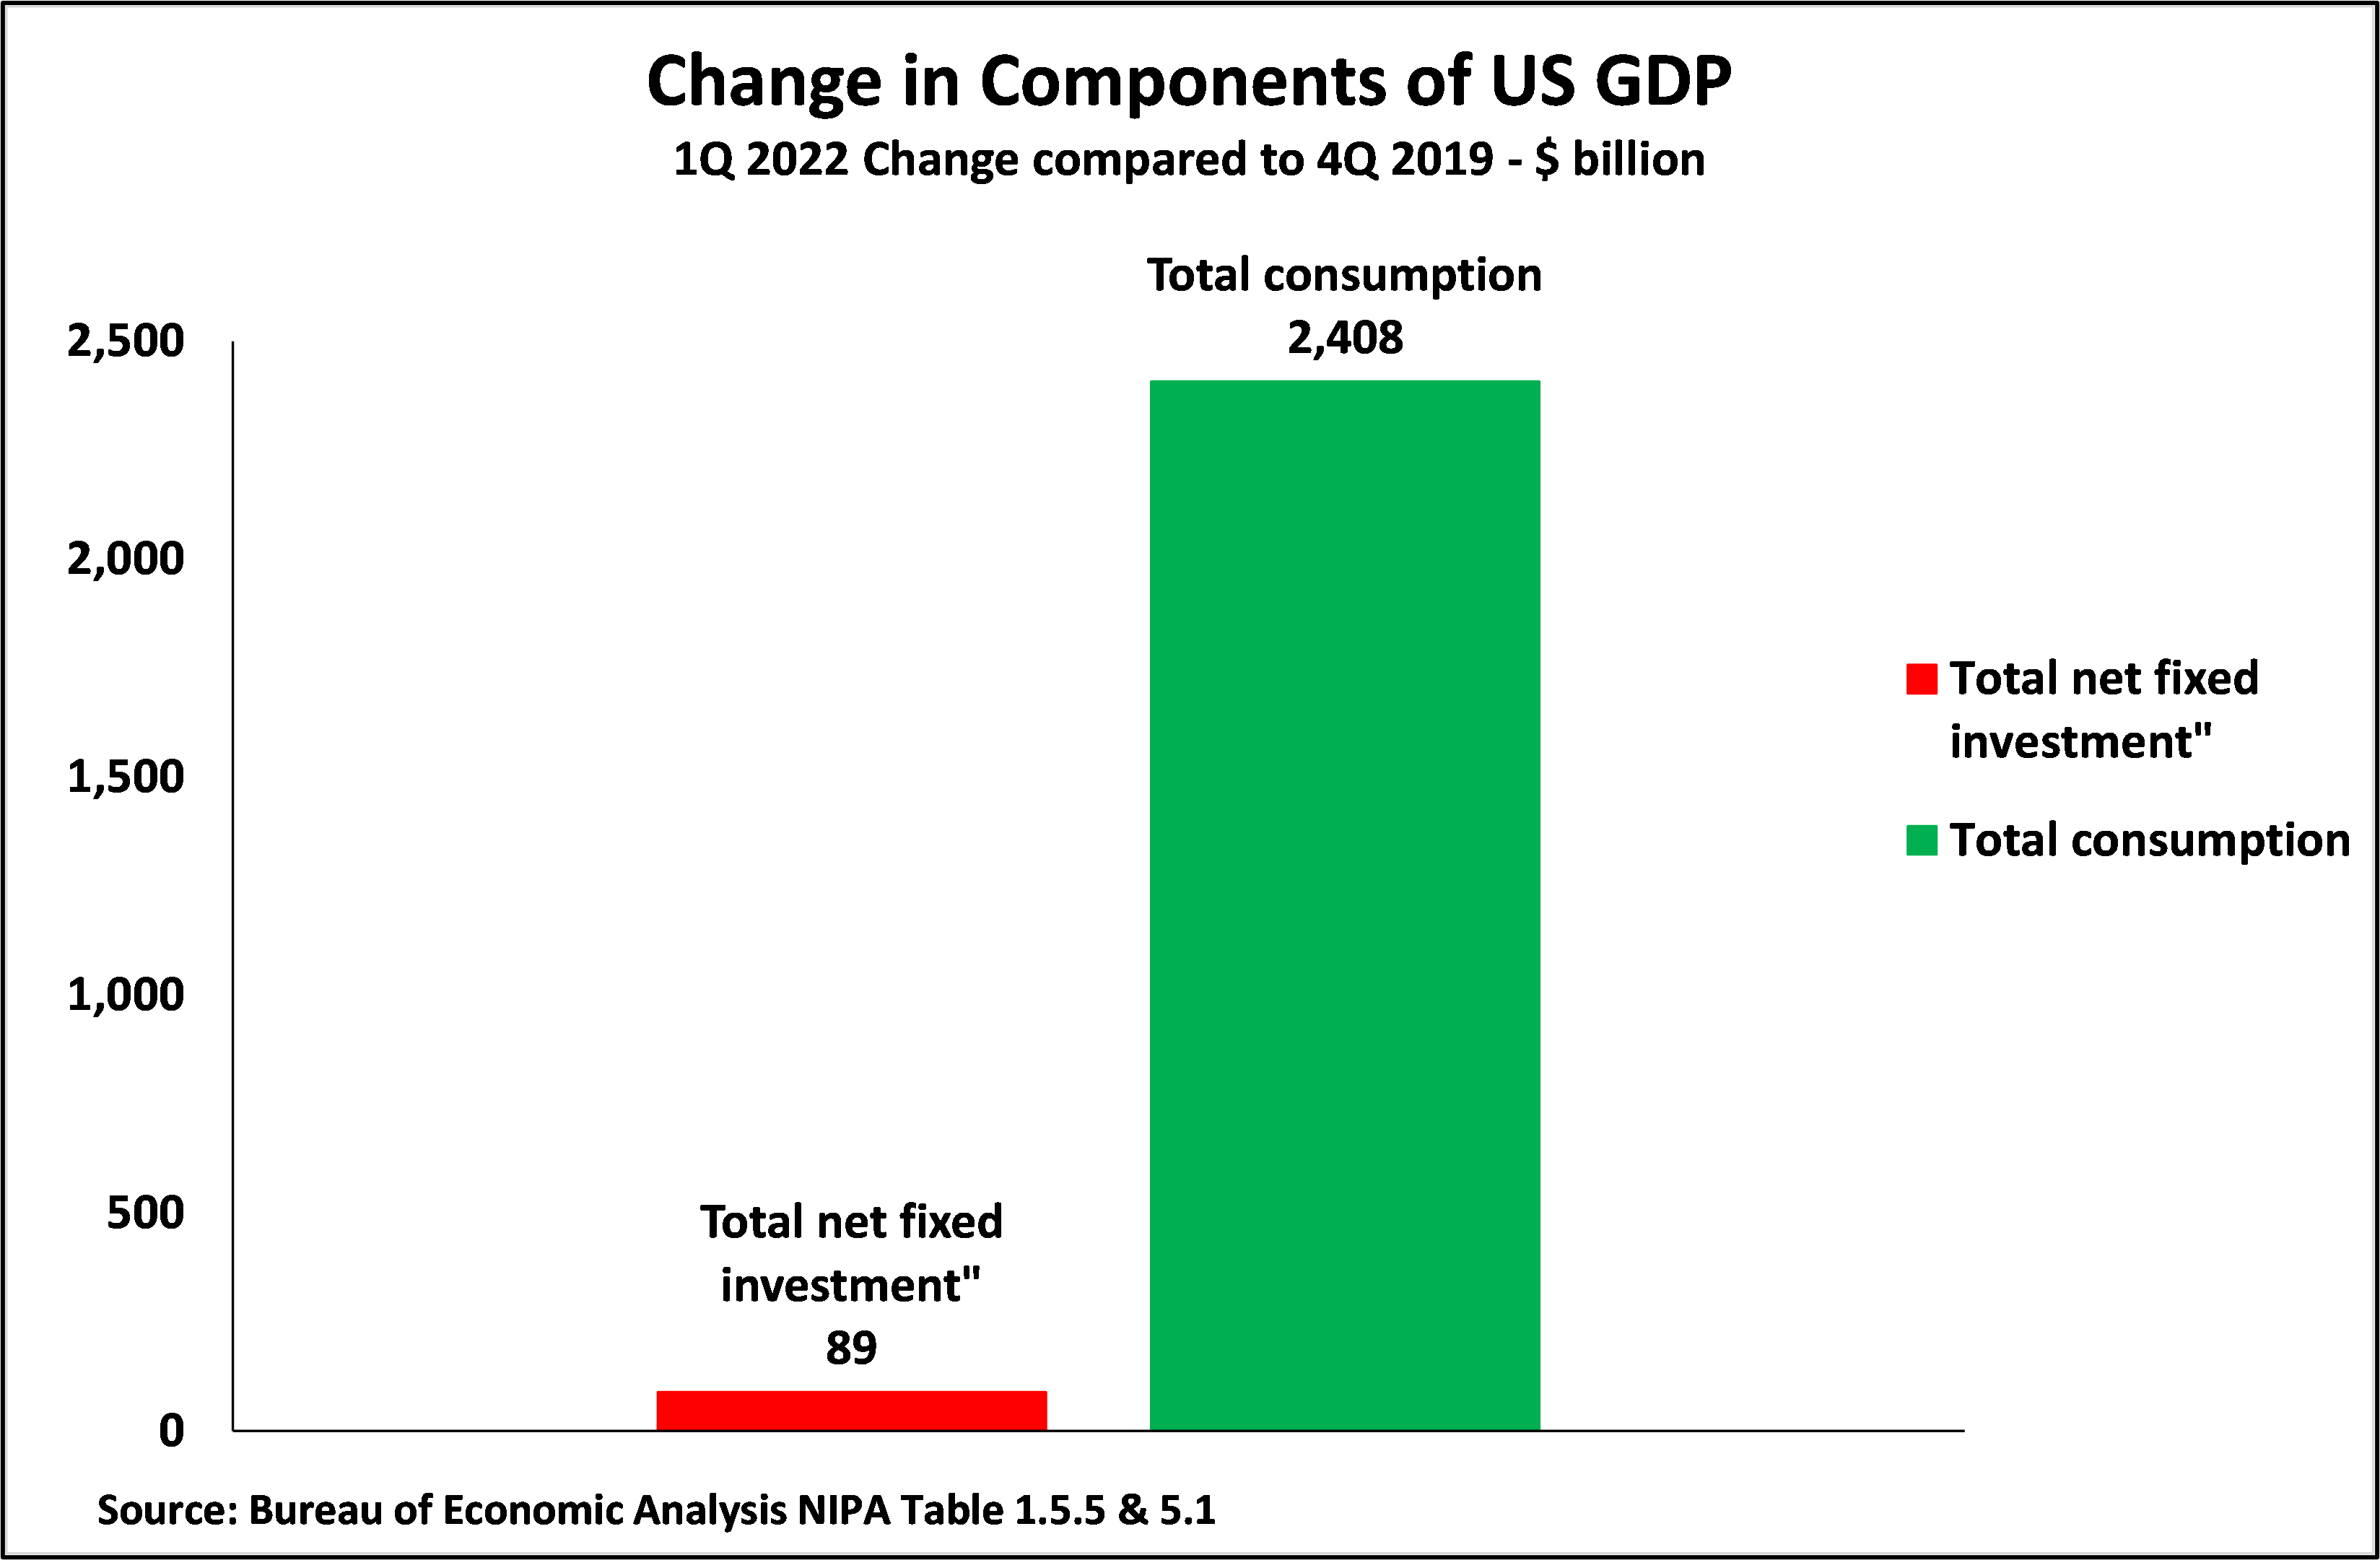
These effects of the Trump/Biden stimulus packages on consumption are seen clearly if the entire period since the 4th quarter of 2019 is considered – that is from immediately prior to the Covid outbreak, up to the latest data for the 1st quarter of 2022. As Figure 4 shows U.S. total consumption increased by $2,408 billion, while U.S. net fixed investment increased by only $89 billion. That is the U.S. increase in net fixed investment was only 3.7% of the rise in U.S. consumption.
Summarising these U.S. stimulus packages, therefore, enormous transfer payments gave a large-scale boost to consumption but there was almost no increase in U.S. net fixed investment, that is almost no increase in the U.S. capital stock. The U.S. stimulus packages were almost entirely focussed on consumption.
Figure 4
The consequences of the U.S. stimulus packages
The consequences of such U.S. stimulus packages were entirely predictable. If the U.S. economy had been in a recession, that is with large scale unused capacity, then the new demand created by the consumer stimulus might have been met by putting unused capacity back to work. That would have meant not only consumer demand would have increased but supply could have been increased without new investment by making use of this previously unused capacity. But in fact, in the 4th quarter of 2019 the U.S. economy was growing significantly above trend – Its year-on-year GDP growth was 2.6% compared to its long term (20 year) average of 2.0%. Indeed, it had been growing above trend since the 2nd quarter of 2017.
Therefore what occurred with the U.S. stimulus packages was that a very large boost was given to the demand side of the economy, in the form of consumption, but almost no increase in the supply side of the economy, in the form of fixed investment, occurred and under conditions where there was no large scale unused capacity that would be put back to work without investment. The consequence of a large increase in demand with no significant increase in supply was entirely predictable – there was an inevitable sharp increase in inflation.
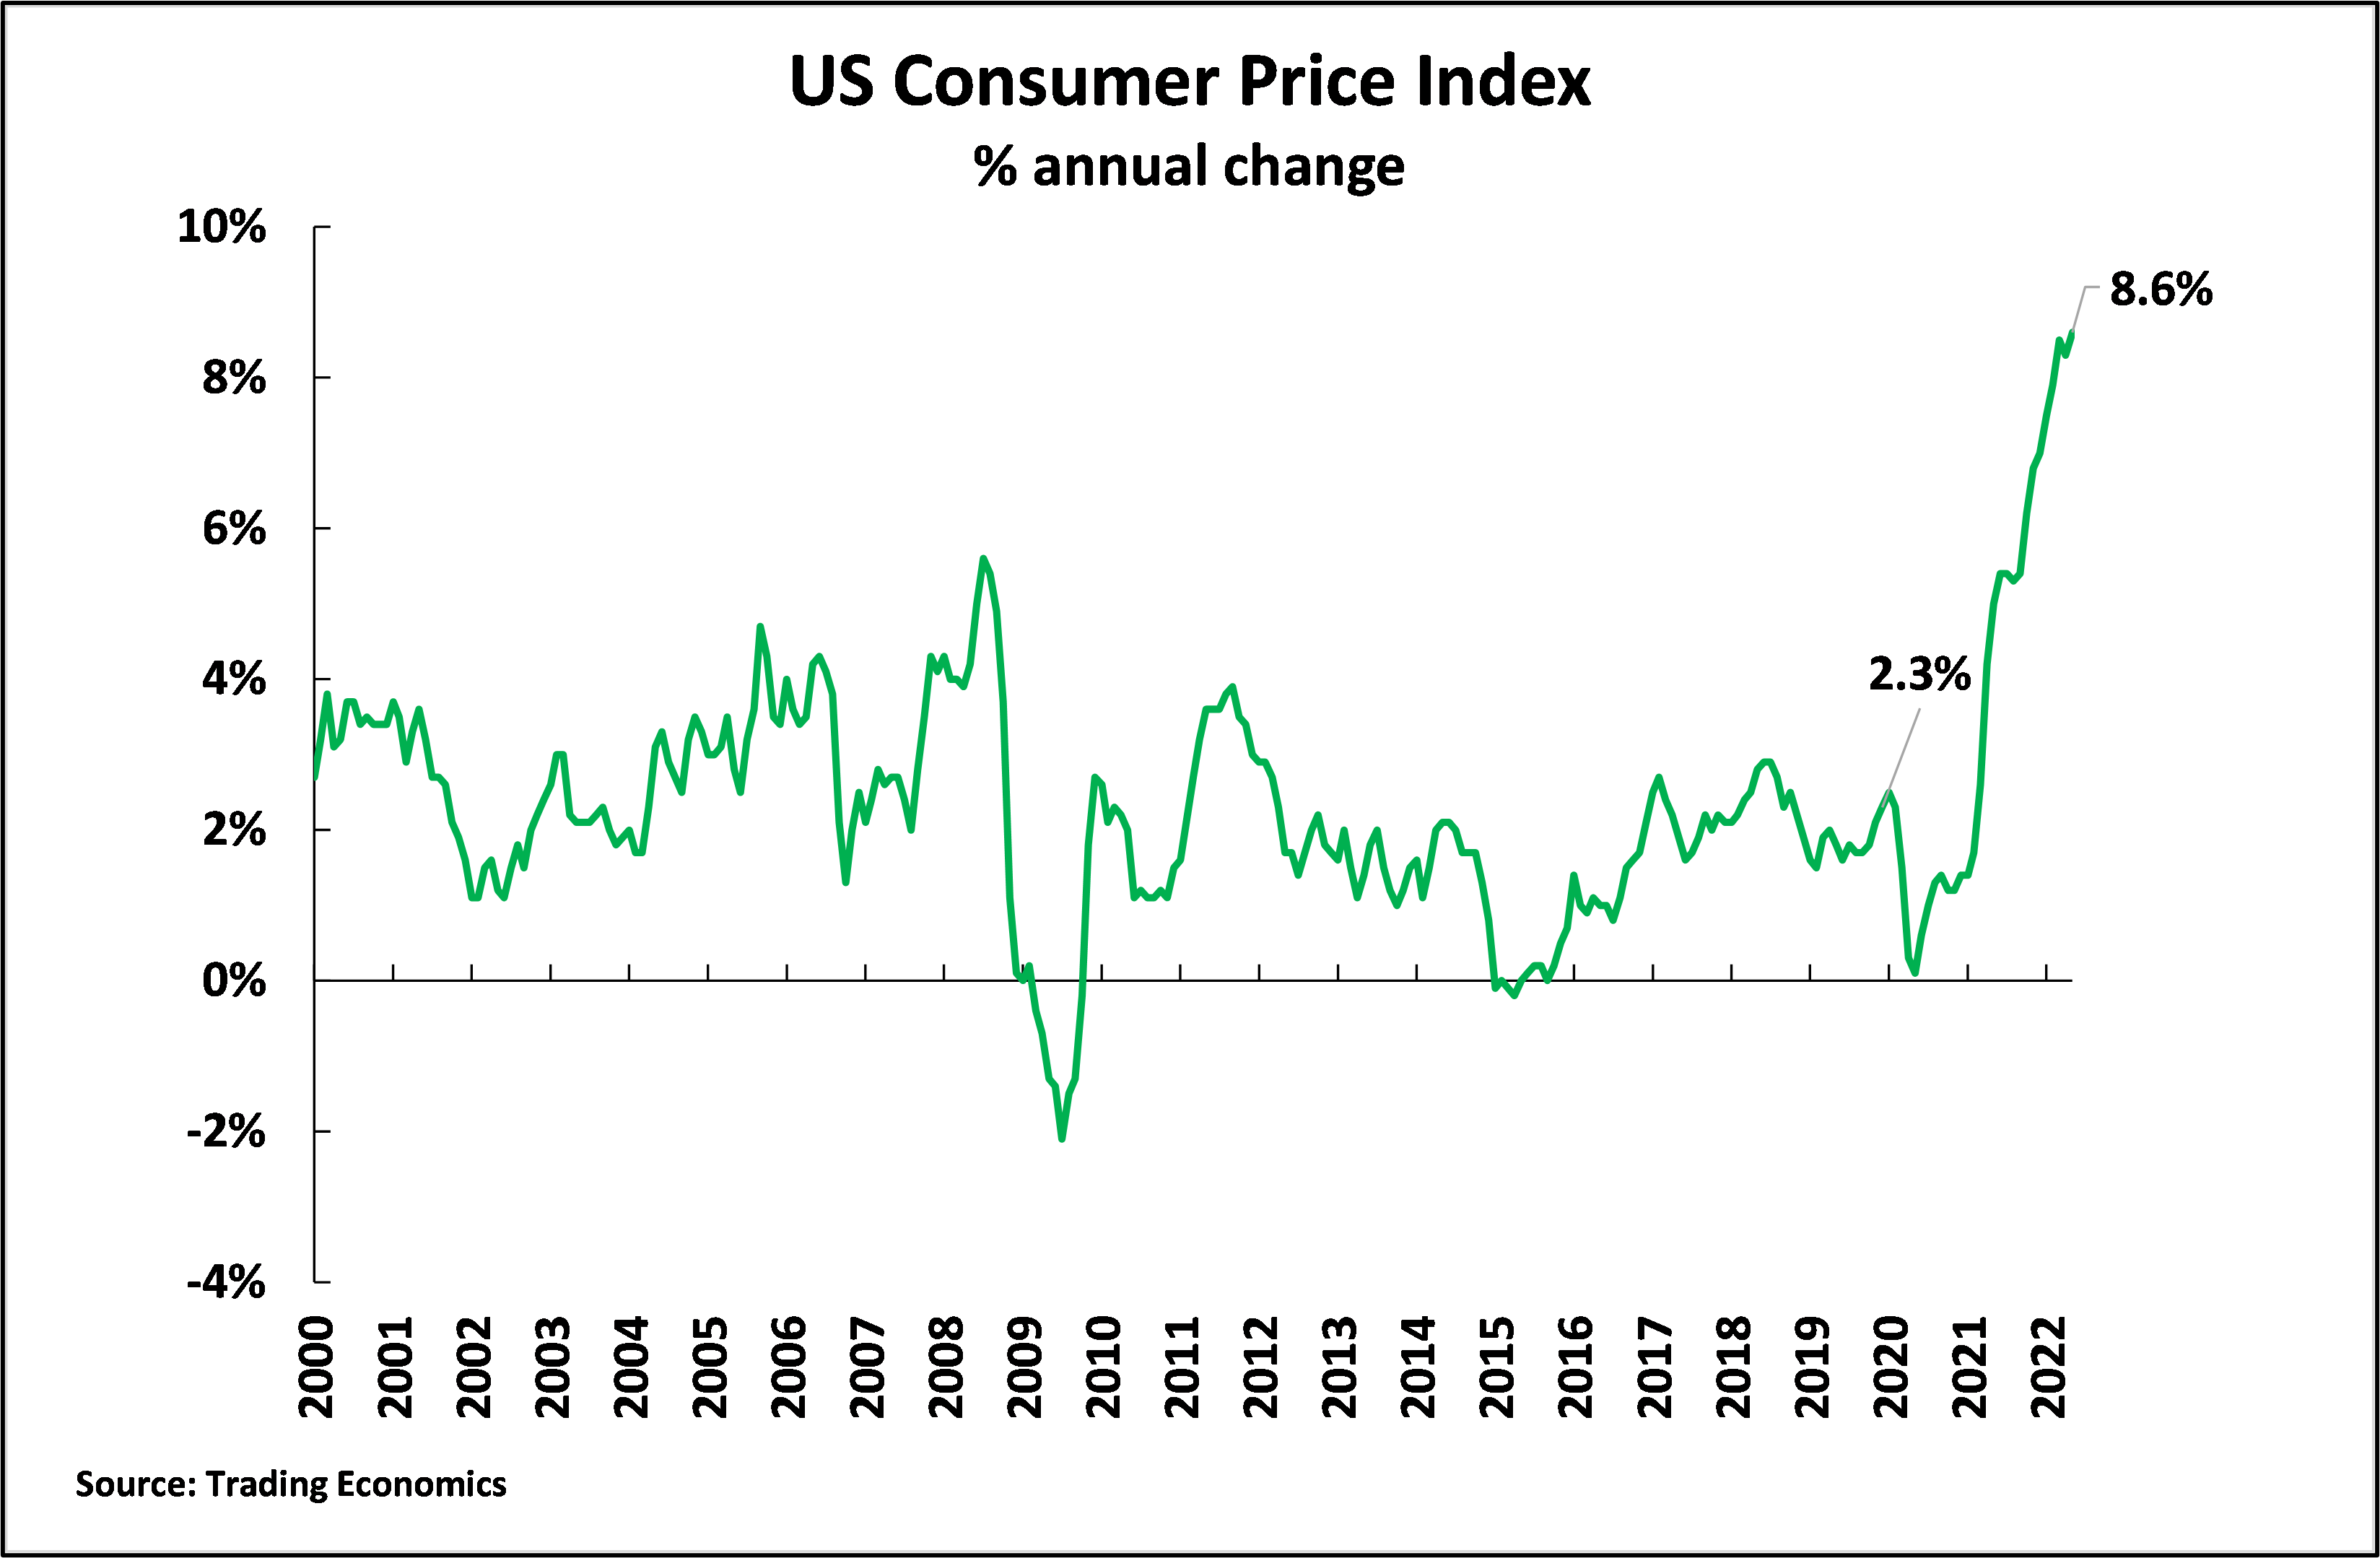
The rise in U.S. inflation
This increase in U.S. inflation began rapidly – rising from 2.3% in December 2019, the eve of the Covid crisis, to 8.6% by April 2022. This is shown in Figure 5. This last 8.6% U.S. inflation figure was the highest for 40 years. But simultaneously with very high inflation the U.S. economy by the beginning of 2022 was sharply decelerating – quarter on quarter annualised GDP growth falling from 6.9% in the 4th quarter of 2021 to a contraction of 1.5% at an annualized rate in the 1st quarter of 2022.
Figure 5
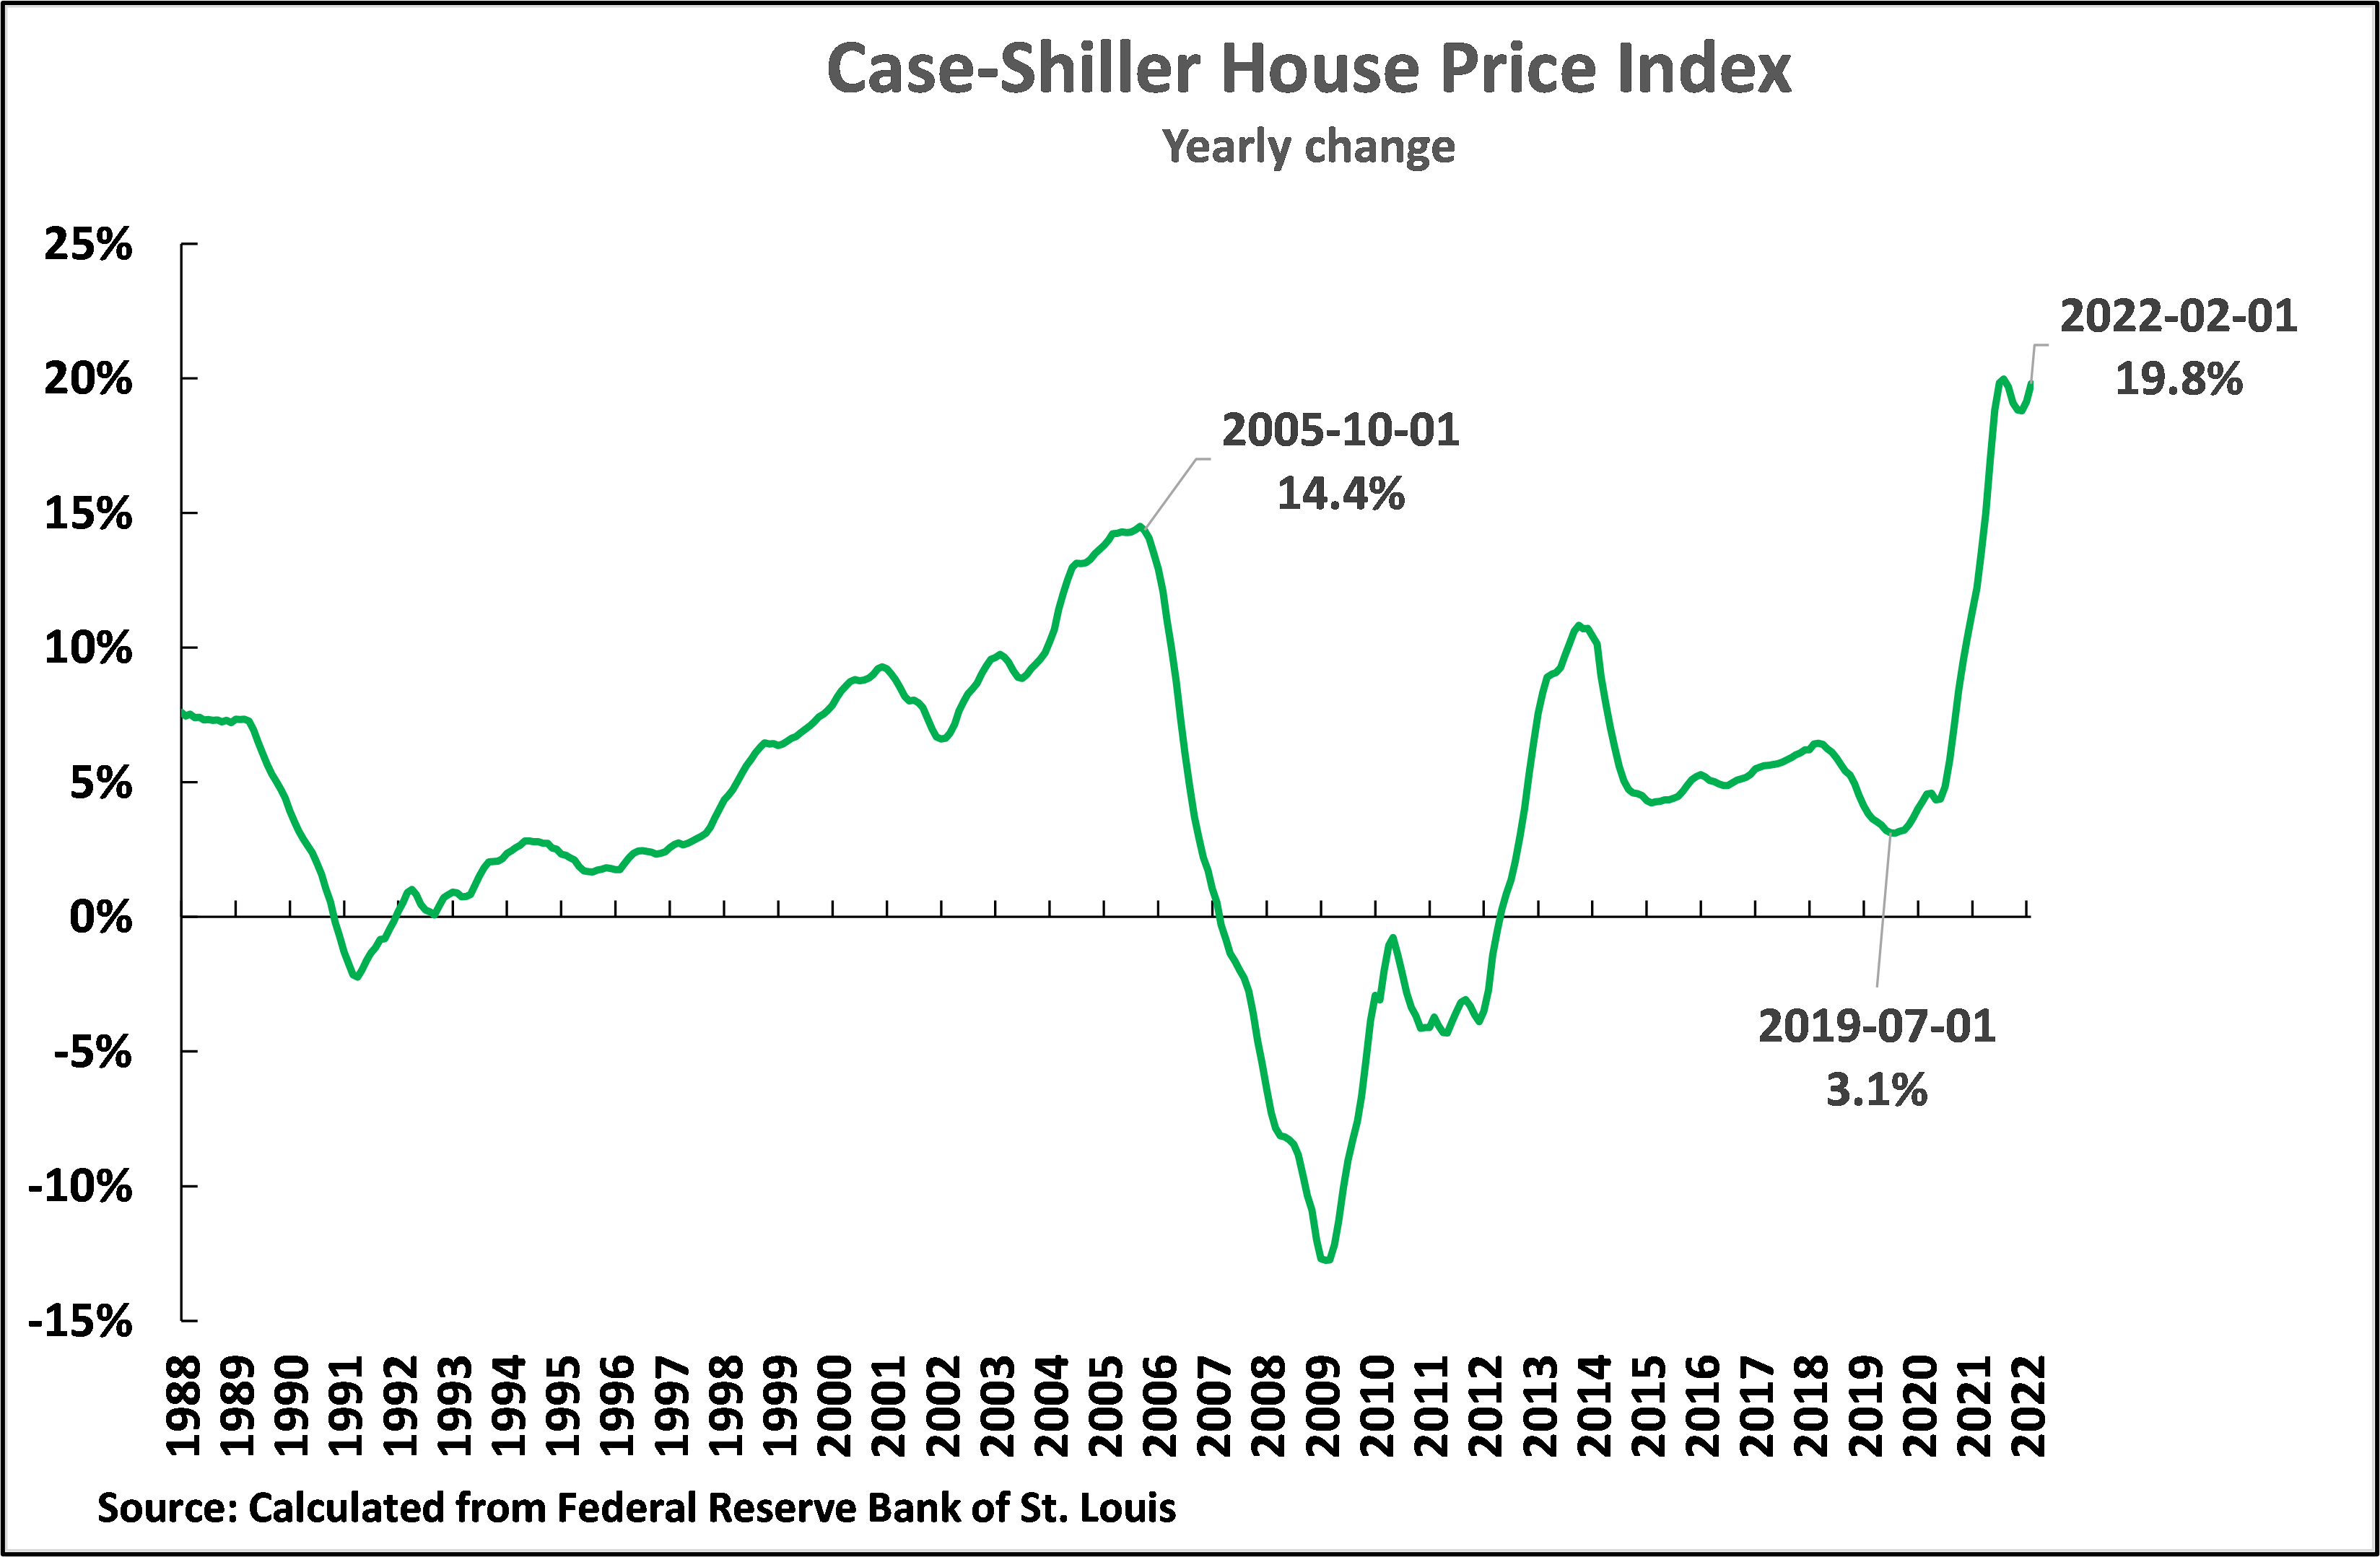
Rapid increase in house prices
The rapid rise in U.S. prices did not only hit consumers but was even greater in asset prices. This was shown in the extraordinarily rapid increase in house prices, which is now more severe than before sub-prime mortgage crisis of 2005-2008. As Figure 6 shows in March 2022 the annual increase in U.S. house prices was 20.6%, compared to only 14.4% at the peak before the U.S. sum-prime mortgage crisis.
Figure 6
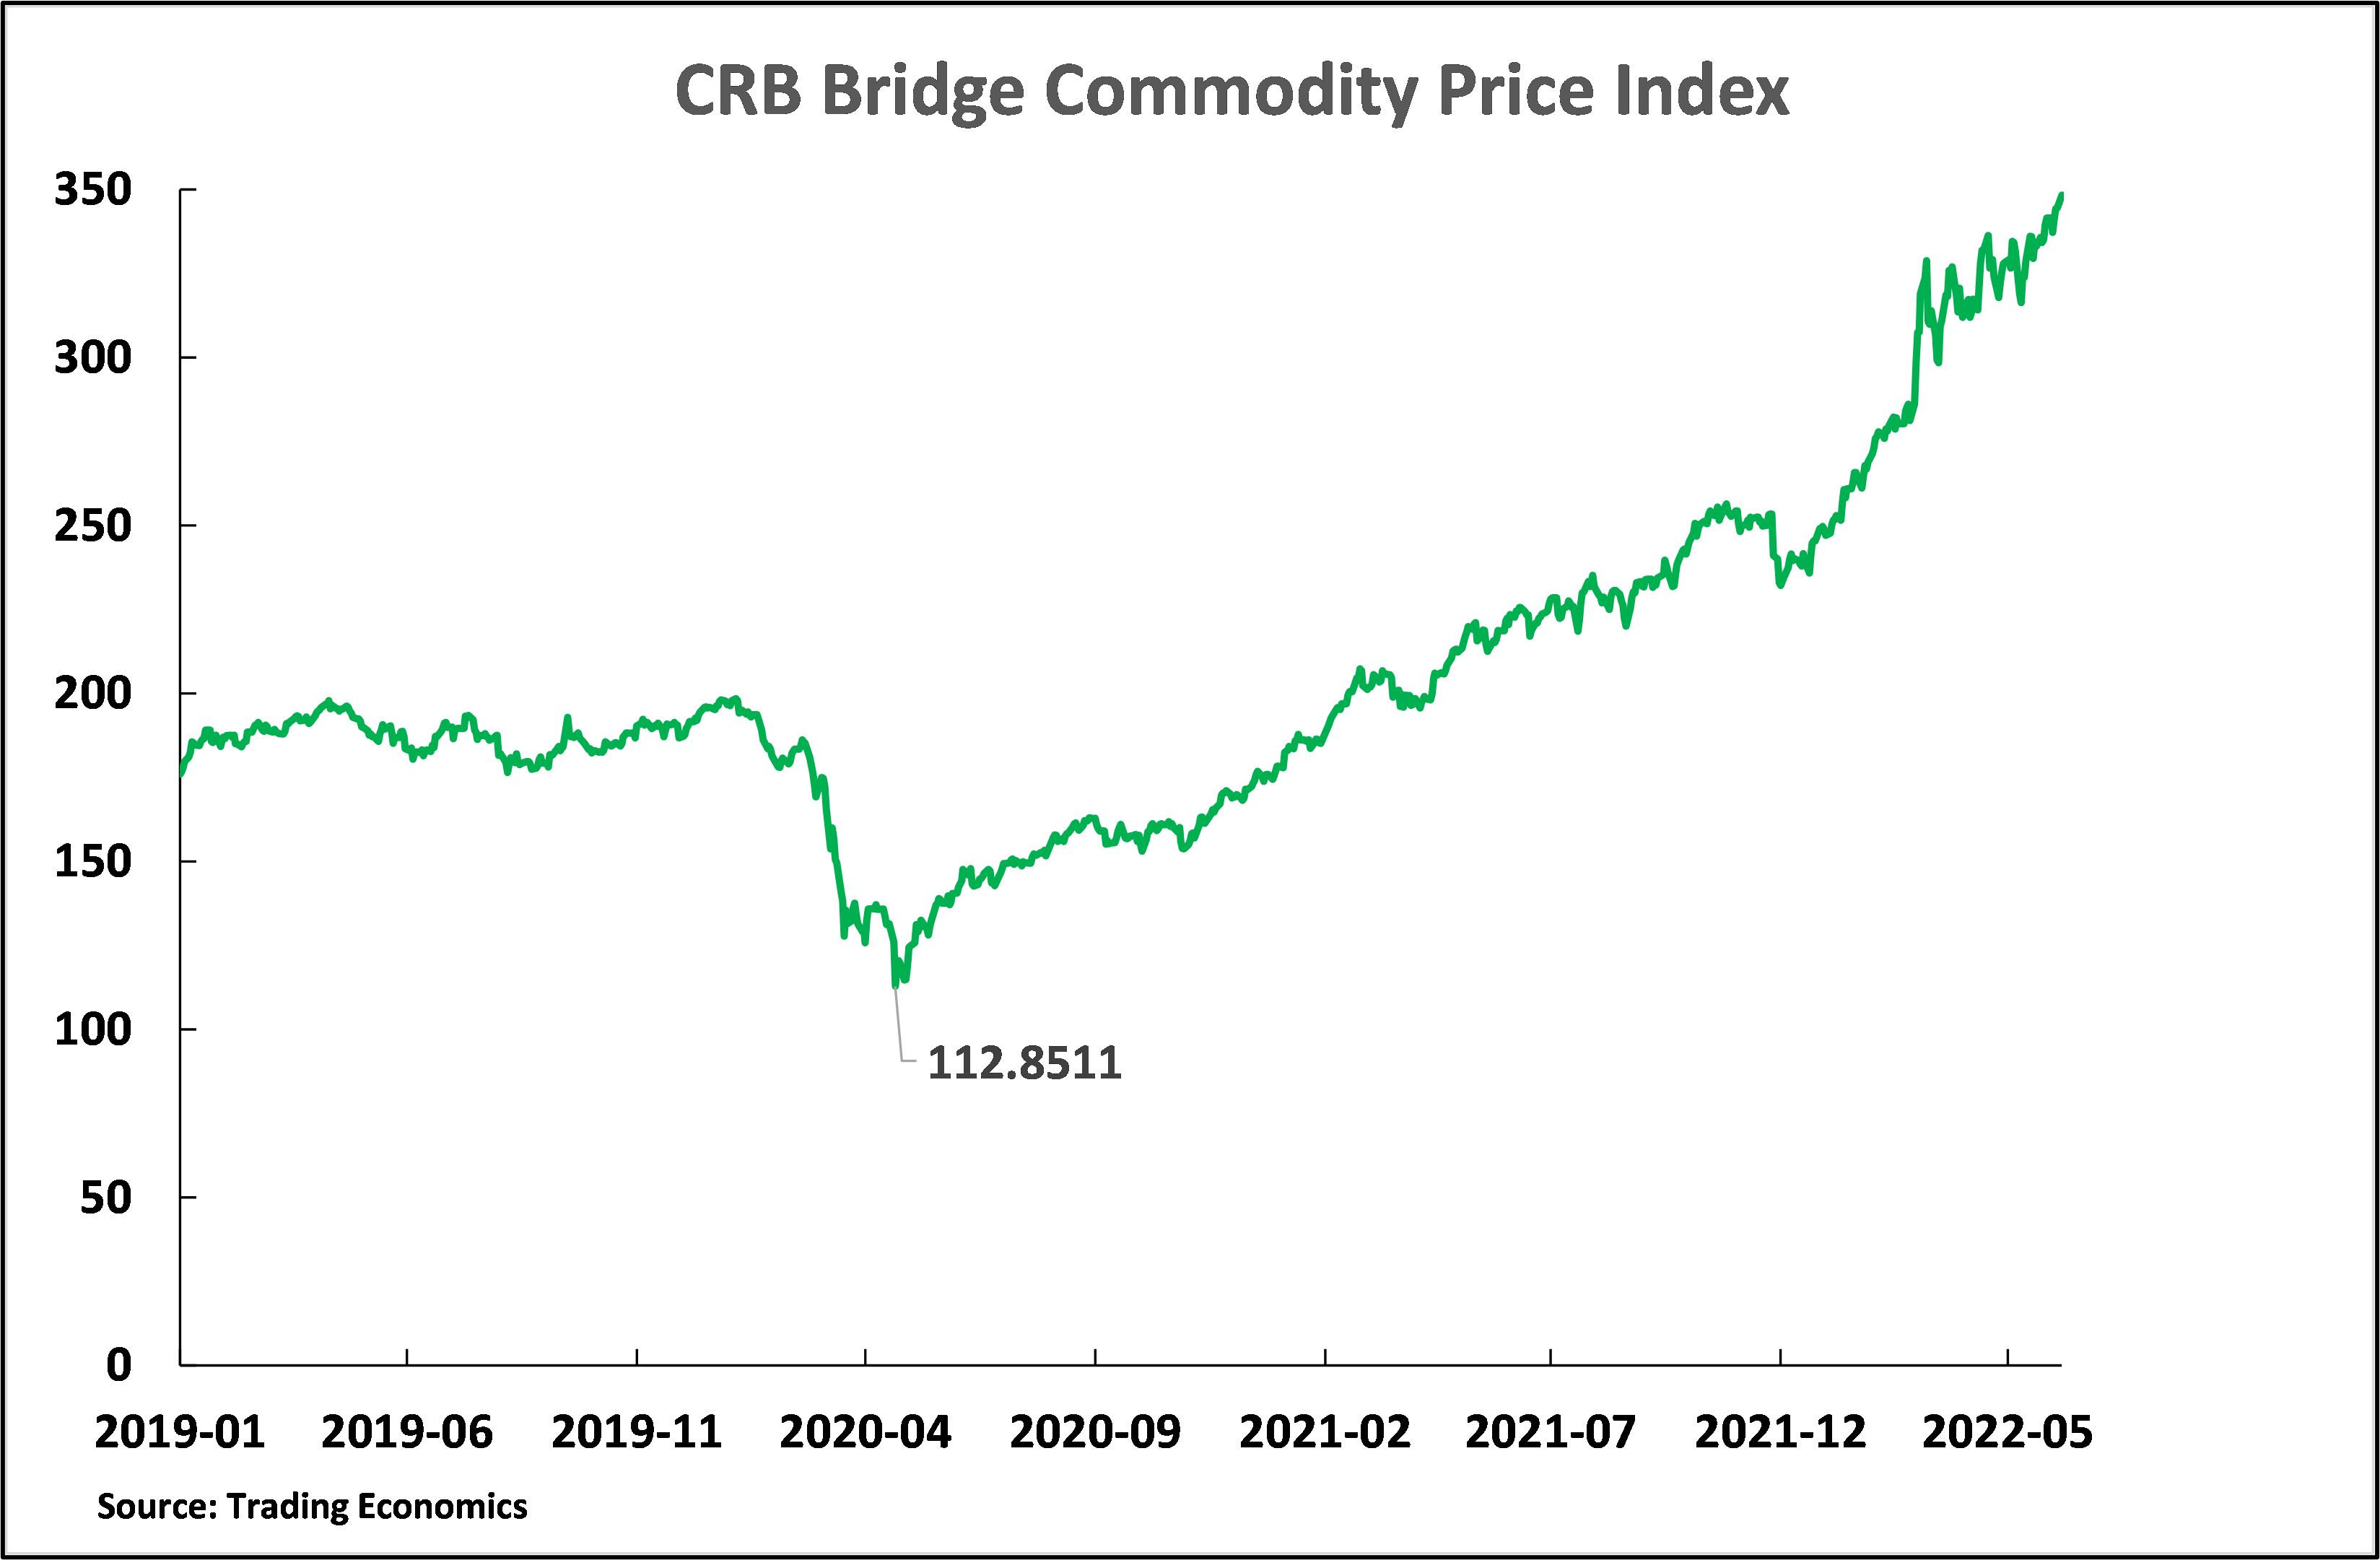
Rising global inflation
As the U.S. is the world’s largest economy at market prices, and dollar is the world’s most important currency, this huge inflationary wave in the U.S. necessarily spread through most of the global economy. This was shown most rapidly in the enormous increase in commodity prices which can be seen in Figure 7 – which shows the internationally followed CRB Bridge index of commodity prices. From a low point of 112.9 on 21 April 2020 this had risen to 348.3 by 6 June 2022. That is commodity prices had almost tripled in two years – sending a huge inflationary shock through the entire world economy.
Figure 7
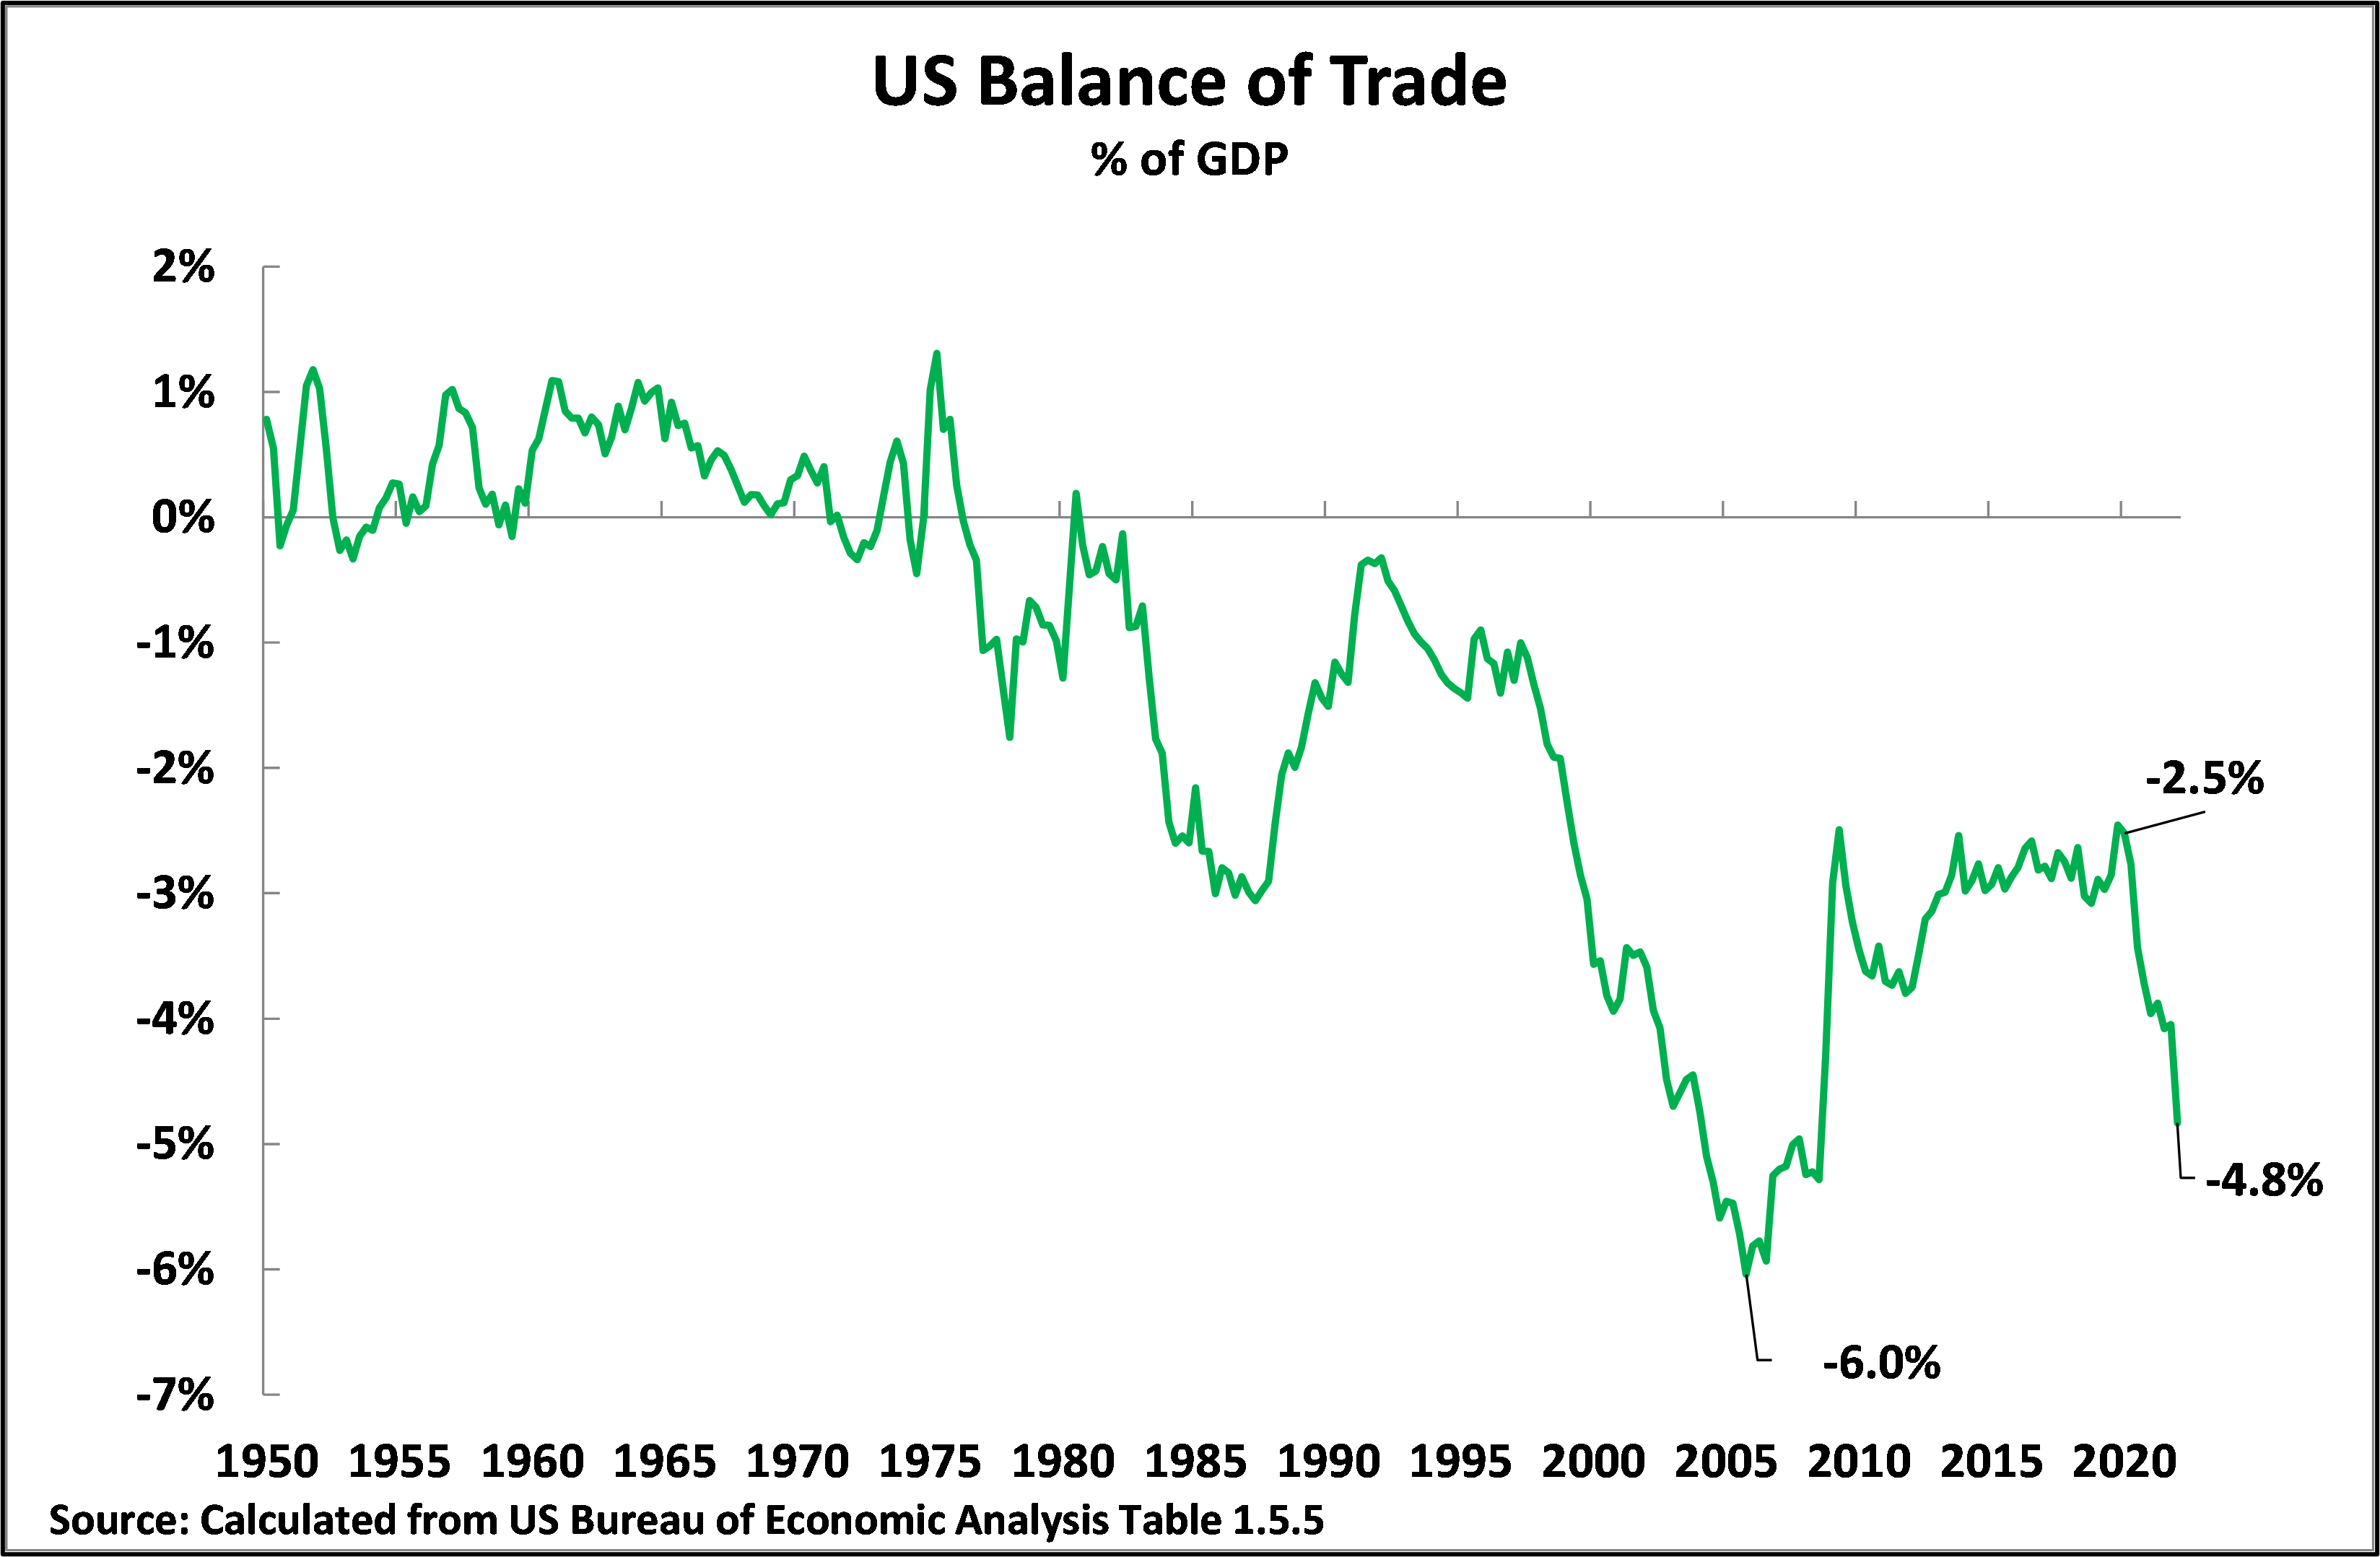
Worsening balance of trade
The second consequence of this large increase in demand in the U.S., with no significant increase in supply, was a rapid increase in the U.S. balance of trade deficit – as the U.S. sucked in goods to attempt to compensate for the shortage of supply. As Figure 8 shows the U.S. balance of trade deficit rose from 2.5% of GDP in the 4th quarter of 2019 to 4.8% of GDP in the 1st quarter of 2022. This is beginning to approach the record 6.0% of GDP balance of trade deficit which appeared prior to the international financial crisis.
Figure 8
Social and political consequences
The consequence of rapidly rising U.S. prices was that U.S. real inflation adjusted wages began to fall rapidly – U.S. real wages fell by 2.7% in the year to March 2022. But in contrast to falling real wages the wealth of the richest American rose rapidly – due to asset price inflation. This was reflected most dramatically in the enormous increase in U.S. billionaire wealth as the Covid pandemic and the stimulus packages began. As a study of this rich social layer noted: “America’s billionaires have grown $2.1 trillion richer during the pandemic, their collective fortune skyrocketing by 70 percent — from just short of $3 trillion at the start of the COVID crisis on March 18, 2020, to over $5 trillion on October 15 of this year [2021], according to Forbes data analyzed by Americans for Tax Fairness (ATF) and the Institute for Policy Studies Program on Inequality (IPS).” That means an enormous transfer of resources is taking place from the working class to capital.
“The $5 trillion in wealth now held by 745 billionaires is two-thirds more than the $3 trillion in wealth held by the bottom 50 percent of U.S. households estimated by the Federal Reserve Board.
“The great good fortune of these billionaires over the past 19 months is even starker when contrasted with the devastating impact of coronavirus on working people. Almost 89 million Americans have lost jobs, over 44.9 million have been sickened by the virus, and over 724,000 have died from it.”
With soaring inflation, real wages falling rapidly, and social inequality rapidly increasing entirely unsurprisingly support for the Biden administration declined rapidly. An average of opinion polls showed approval of Biden fell from 53% at the time of his inauguration to 41% by May 2022. A recent Reuters/Ipsos poll saw Biden’s approval rating falling to 36%, with 59% disapproval, on 24 May. There is no doubt as to the reason for this sharp increase in dissatisfaction with Biden. Polls showed that Americans overwhelmingly consider the economy is the most important question confronting them – 68% saying this was the most important issue, almost twice as many as the second most important issue, the Covid pandemic, which was named by 37%. Given the rapid rise in dissatisfaction with the Biden administration most commentators in the U.S. assumed that the Democrats would lose control of Congress in the mid-term Congressional elections in November.
Changes in the structure of U.S. GDP
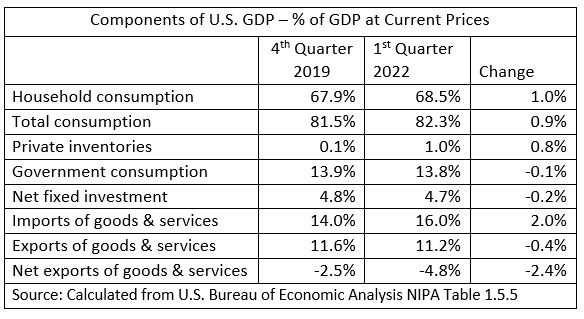
Finally, to show the most fundamental processes Table 1 gives the shifts in the structure of U.S. GDP accompanying this rapidly rising inflation between the 4th quarter of 2019, the last before Covid19 struck, and the latest data for the 1st quarter of 2022.The most striking features are:
- The rise in the proportion of the U.S. economy devoted to consumption. Household consumption has risen by 1.0% of GDP and total consumption by 0.9% of GDP.
- An accumulation of inventories has taken place, rising by 0.8% of GDP.
- Net fixed investment, that is taking account of depreciation of fixed capital, fell by 0.2% of GDP.
- The fact that consumption, is rising as a percentage of the U.S. economy is accompanied by a significant worsening of the U.S. trade balance – which has deteriorated by 2.4% of GDP.
Therefore, in summary, the structural effect of COVID economic downturn and the stimulus packages in the U.S. is that:
- The U.S. economy is becoming more dependent on the inflow of resources/finances from abroad, as shown in the worsening trade deficit.
- These extra resources financed from abroad are primarily going into increased consumption and not investment – U.S. net fixed investment has scarcely risen in dollar terms and has actually marginally fallen as a percentage of GDP.
The consumption focussed character of the Trump/Biden stimulus packages is therefore entirely clear.
Table 1
The overall effects of the U.S. stimulus packages
Summarising these developments, they confirm that the claim by the U.S. that the rapidly worsening global economic situation is due to the war in Ukraine is simply factually untrue – the extremely rapid rise in inflation started long before the Ukraine war started, and that war simply made somewhat worse a process which was already well underway. This extremely rapid rise in U.S. inflation was instead an entirely predictable result of the huge consumer stimulus packages launched in the U.S. As the Wall Street Journal editorial board noted ‘This Isn’t Putin’s Inflation. The price rises began long before Russia invaded Ukraine… This inflation was made in Washington.”
These U.S. stimulus packages have therefore produced negative economic consequences. They have added to the wealth of the richest people in the U.S. but they have destabilised the entire world economy, they have led to falling incomes for the mass of the U.S. population, and they are destroying the political support of the Biden administration. It is, therefore, hard to think of policies with more negative consequences in the present economic situation. What therefore led to such damaging policies?
What led to these very negative developments?
It is obvious that the extremely destabilising economic consequences that resulted from the U.S. stimulus packages are so powerful that they must have been produced by deep social forces – these are analysed below. Nevertheless, these policies also reflected conceptual confusion and theoretical errors in Western economics. These errors provided the rationalisation for these damaging policies. As some of these errors and confusions are also seen in parts of the media in China, and could therefore have the same negative consequences as in the U.S., it is therefore first worth analysing these.
Confusion on consumption’s role in the economy
The fundamental reasons for the deep problems in the Trump and Biden stimulus packages becomes clear when a key theoretical confusion in much writing in popular “Western” (more precisely “marginalist”) economics is eliminated. This runs like a thread through much Western economic material, creating confusion and being used to obscure economic reality. Regrettably, the same confusion sometimes appears in the Chinese media.
This fundamental confusion is on the role of consumption in the economy – as was seen the U.S. stimulus packages were overwhelmingly focussed on consumption. This error is an erroneous concept that consumption is a contribution, an input into, GDP growth. This confusion was rightly analysed, for example, by John Papola as follows: “The systematic failure… to distinguish between consuming and producing value is the single most damaging fallacy in [Western] popular economic thinking.”
This fundamental confusion is popularly expressed in statements that consumption is a contribution increasing GDP growth. Thus, for example, to take the Bank for International Settlements (BIS), a paper for this claims: “In major advanced economies, consumption contributed up to 1 percentage point to GDP growth.” Similarly, another BIS paper claims: “Consumption has provided the main contribution to growth recently.” Another paper for the BIS declares: “Personal consumption expenditures are projected to contribute two-thirds of the growth of GDP.” And “Personal spending on services is anticipated to contribute 36.9 percent of the growth in GDP.” Similarly the European Central Bank claims that “Average contributions to GDP growth” of consumption was 0.2% a quarter in 2013-2018.
Consumption, by definition, is not an input into production
The errors of such statement may be seen immediately the economic definition of consumption is stated. Consumption, by definition, is not an input into production – therefore if anything is an input into production, that is a contribution to it, it is by definition not consumption. But anything which is not an input into production cannot constitute any contribution to the increase in production – and therefore it cannot increase GDP. The contribution of consumption to increased production is therefore always, in all places and at all times, precisely zero.
It is certainly accurate to say, for example, to correct the BIS’s error, that “two thirds” of the economy/GDP is consumed. But that does not at all mean that consumption “contributes” two thirds of GDP growth – on the contrary, as consumption by definition is not an input into production, consumption contributes precisely nothing to GDP growth, it simply means a large part of GDP growth is consumed
To put this in technical terms, consumption is not an input into the production function. This is the case both in terms of “Western” (more accurately marginalist) economics and Marxist economics. In Marxist terms the inputs into production are living labour (“variable capital”) and the outputs of other producers (“constant capital”). In “Western” economics there are various analyses of inputs into production functions. The most well-known is Solow’s growth accounting analysis – which has as inputs capital, labour and total factor productivity (TFP). Other Western economics production functions include intermediate products or, in a more detailed framework, Jorgenson’s KLEMS (Capital, Labour, Energy, Materials, Services) analysis. But no production function, in either “Western” or Marxist economics, includes consumption – necessarily so because consumption is not an input into production!
Put it in more simple terms, consumption is part of the demand side of the economy, but by definition it is not part of the economy’s supply side – if something is an input into the economy’s supply side it is, by definition, not consumption. The contribution of consumption to GDP growth is therefore always exactly zero.
Disastrous effects
Once the fact that the input of consumption to increases in production is always by definition precisely zero, and therefore consumption’s contribution to increases in GDP is also precisely zero, it then immediately becomes clear why the Biden/Trump stimulus packages produced such negative consequences. As consumption is part of the demand side of the economy, but not of its supply side, the huge boost to consumption therefore produced an increase in demand but by itself produced no increase in supply.
It is, in some circumstances, possible for an increase in demand to lead indirectly to an increase in production – because the economy’s supply side may increase output to meet the increase in demand. But this effect is only indirect as consumption, by definition, itself contributes nothing to the increase in the supply side. This indirect effect is why an increase in consumption, in the demand side of the economy, can sometimes be accompanied by an increase in GDP – which reinforces the false conception that consumption can be a contribution to increases in production. But, as already seen, the increase in consumption does not itself directly cause any increase in production, because consumption is not an input into production.
Once this confusion regarding the role of consumption in the economy is removed then the reasons for the extremely negative effects of the U.S. consumer focussed stimulus packages becomes clear.
- First, as already analysed, at the end of 2019, immediately before the pandemic struck, the U.S. economy had been growing above its historical trend for a significant period. The recession caused by Covid did, of course, very temporarily produce unused capacity but this was rapidly put back to work as the economy recovered. U.S. capacity utilisation in January 2020, immediately before the pandemic struck, was 76.1%, it then fell as Covid spread, but recovered to 76.2% by July 2021 and by April 2022 had risen to 79.0% – above the pre-pandemic level.
- Second, the huge increase in money supply was itself inflationary.
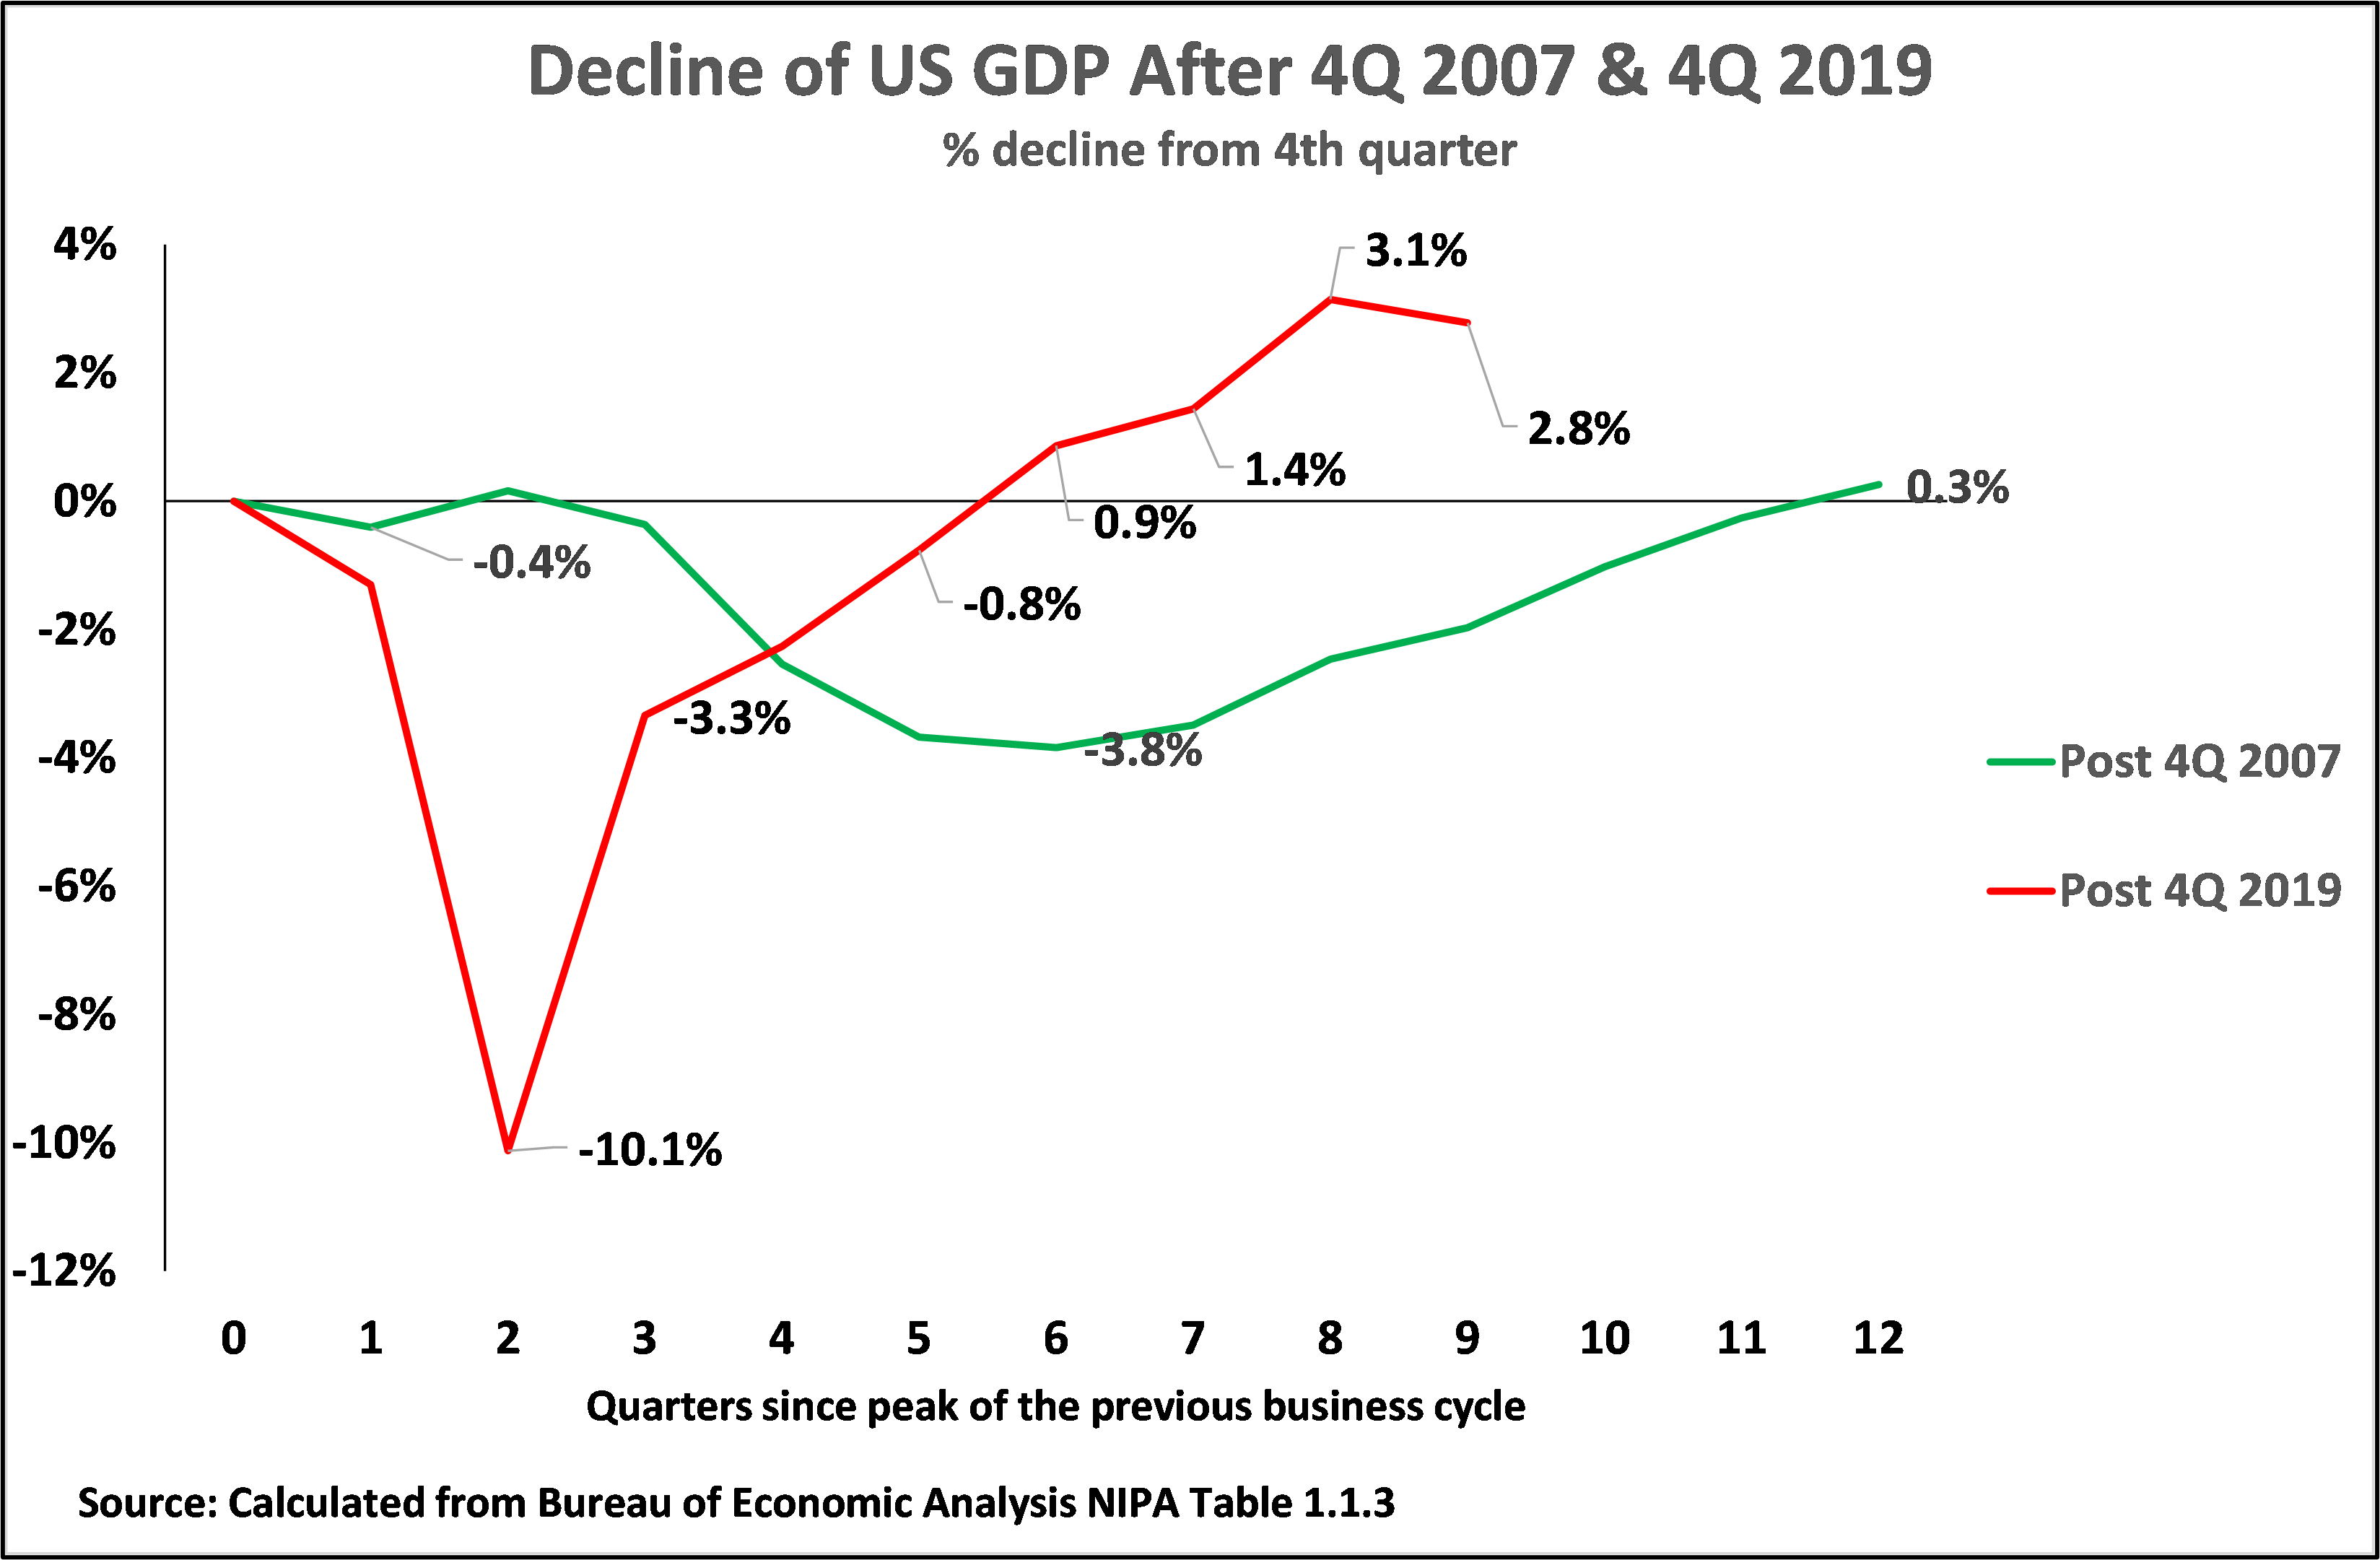
- Third, whether due to the nature of the Covid pandemic, the consumer stimulus, or some other factor, U.S. recovery from the covid recession was rapid. To make a comparison, Figure 9 shows that whereas it took 12 quarters for U.S. GDP to recover to pre-recession levels during the international financial crisis, in contrast recovery to pre-recession levels was achieved after only six quarters during the Covid economic downturn – that is by the 2nd quarter of 2021.
Therefore, by the 4th quarter of 2021, U.S. GDP was 3.1% above its pre-recession levels, but as already noted, there was no significant increase in U.S. net fixed investment in the entire period since the beginning of the Covid crisis. Therefore by at least the 2nd quarter of 2021 the U.S. economy was expanding above its 4th quarter 2019 levels with no increase in investment. As in the 4th quarter of 2019 the U.S. economy had already been growing faster than trend this increase in U.S. GDP to above pre-pandemic levels, with no increase in fixed investment for the supply side of the economy, inevitably added to inflationary pressures. In short, the very rapid increase in U.S. inflation which began to take place well before the Ukraine war was entirely predictable from the fundamental trends within the U.S. economy and the nature of the consumer led stimulus packages which were carried out. – i.e. producing an increase in demand (consumption) with no increase in supply (investment).
Figure 9
Long term effects on growth
The short-term destabilisation of the global economy caused by the U.S. stimulus packages of course is extremely striking. But it is only an extreme illustration of the damage done by confusion over the role of consumption in the economy – this confusion also affects long term growth. Indeed, clarifying this theoretical conclusion leads to immediate factual, and therefore testable, conclusions which further clarifies the reasons for the damaging effects of the almost entirely consumer-based U.S. stimulus packages.
This prediction from fundamental economic theory is that because consumption, by definition, is not an input into production, other things being equal, the greater the share of consumption in the economy the slower will be economic growth. Equally because, by definition, investment is an input into production, then, other things being equal, the higher the percentage of investment in the economy the more rapid will be economic development. This factually testable conclusion, as will be seen, is fully confirmed by the data on the U.S. economy.
Clarity on consumption
Once the theoretical clarification is made on consumption then these clear and factually testable predictions immediately show the falsity of the confused ideas on consumption frequently expressed in popular Western economics which have already been noted. These directly explain the failure of the Trump/Biden stimulus packages and also have clear consequences for China. These conclusions, which follow from economic theory, are that other things being equal:
- Far from consumption being a contribution to GDP growth the higher the percentage of consumption in GDP the slower will be GDP growth.
- Because of the close correlation between GDP growth and consumption, the higher the percentage of consumption in GDP the slower will be the real growth rate of consumption.
- Therefore, far from a higher percentage of consumption in GDP, and rapid growth of consumption, being complimentary goals they are contradictory. If the aim is a rapid growth in consumption, then the means to achieve this, except in the very short term, has to be a low percentage of consumption in GDP – a higher percentage of consumption in GDP will lead to lower consumption growth.
As will be seen analysis of the U.S. economy fully confirms these theoretical predictions.
Having noted these theoretical points a factual analysis can now be made of now be made of not only the short but the medium and long-term trends in the U.S. economy – this allows the consequences of the Biden stimulus package to be still more clearly understood.
The slowing of the U.S. economy
The changes in the structure of the U.S. economy which have been produced by the COVID stimulus packages have already been analysed. But in addition to their negative short term consequences how do these correspond, or fail to correspond, to the changes required to speed up U.S. economic growth over the medium and longer term?
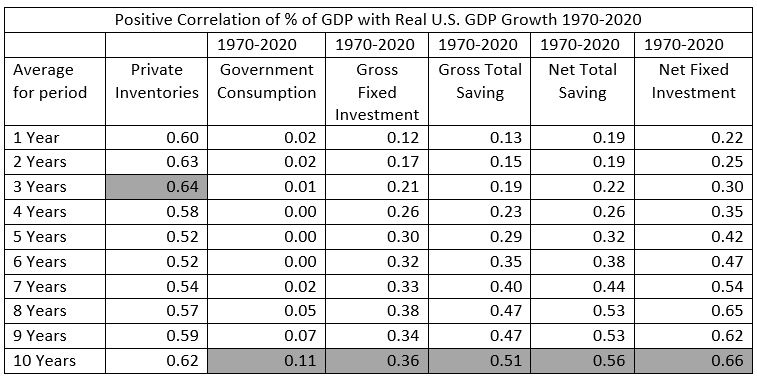
To analyse this Table 2 shows the factual positive correlation between real (inflation adjusted) U.S. GDP growth and the major components of the U.S. economy – measured as a percentage of GDP at current prices. The reason for analysing these correlations over different short and longer time periods, ranging from one to 10 years, will become clear as soon as the factual results are considered.
The first feature which is clear from Table 2 is that over the short term there is no close correlation between any structural component of U.S. GDP and the rate of U.S. GDP growth (except for private inventories – which is clearly a reflection of short term flucuations in the business cycle as inventories are not an element of long term growth). Leaving inventories aside the closest correlation between a structural component of the U.S. economy and short term U.S. economic growth is between net fixed invesment and GDP growth, but this is only 0.22 over a one year period and 0.25 over a two year period – neither of which can be considered a close corelation.This therefore shows that over the short term no single structural factor of U.S. GDP has a decisive influence on U.S. economic growth – a similar short term situation will be found when negative correlations with U.S. economic growth are analysed below.
However, if longer time periods are considered then the situation is very different. Taking a 10 year period the positive correlation between the share of net fixed investment in the U.S. economy and GDP growth is 0.66 – a very high correlation. That is, the higher the percentage share of net fixed investment in GDP the faster the rate of U.S. GDP growth. There are also a high positive correlations of 0.56 between U.S. net total saving and GDP growth (total saving meaning not just household saving but the combined saving of households, government and companies), and total gross saving and GDP growth – at 0.52. in summary whereas there is no short term close correlation between components of U.S. GDP and economic growth there are strong long term correlations, particularly with net fixed investment.
For present purposes it is not necessary to determine why there is this close positive long term correlation between net fixed investment and U.S. GDP growth – although an obvious explanation would be the positive cumulative effect of high levels of fixed investment in increasing U.S. capital stock. Nor is it even necessary, for present purposes, to determine the direction of causation between high levels of net fixed investment and high levels of GDP growth, or even to ascertain whether some third process determines both. It is simply sufficent to note that, due to this high correlation, the U.S. economy cannot achieve high levels of GDP growth without there also being high levels of net fixed investment in GDP. In other words, if over the longer term the U.S. economy is to grow more rapidly the percentage of net fixed investment the U.S. economy must increase.
This, therefore, provides the fundamental criteria for evaluation of the effect of the Trump/Biden stimulus packages on longer term U.S. economic growth. As already noted the Trump/Biden stimulus packages have failed to raise U.S. net fixed investment – on the contrary U.S. net fixed investment has fallen marginally as a share of U.S. GDP during these stimlus programmes . Given that the closest correlation for U.S. GDP growth is with net fixed investment the Trump/Biden stimulus packages will therefore fail to raise the rate of U.S. long term economic growth.
Table 2
Negative effects on U.S. growth
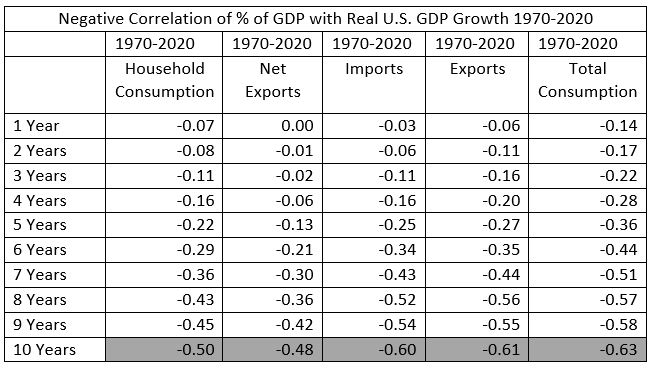
In order to clarify these trends further, so far factors which are favourable for U.S. economic growth have been considered. However, it is also possible to analyse those factors which are negative for U.S. growth. Table 3 therefore shows the negative correlations between components of GDP and U.S. economic growth. As may be seen, once again there are no short-term correlations. The highest negative correlation over a one-to-two-year period is –0.17 for total consumption with GDP growth – which cannot be considered a close correlation. However, once again, there are strong long-term correlations. Strongest of all is the negative -0.63 correlation over a 10-year period between the percentage of GDP devoted to total consumption and U.S. economic growth. That is, the higher the percentage of consumption in U.S. GDP the slower is long term U.S. economic growth. This entirely confirms, from a factual angle, the theoretical point made above, that because consumption is by definition not an input into production an increase in the percentage of consumption in GDP will lead to slower economic growth.
As already seen the Trump/Biden stimulus packages raised the percentage of total consumption in U.S. GDP. As the closest negative correlation in U.S. GDP growth is with the percentage of total consumption and economic growth the Trump/Biden stimulus packages will therefore have a negative effect on long term U.S. economic growth.
Table 3
Why is the U.S. growth rate continuing to slow?
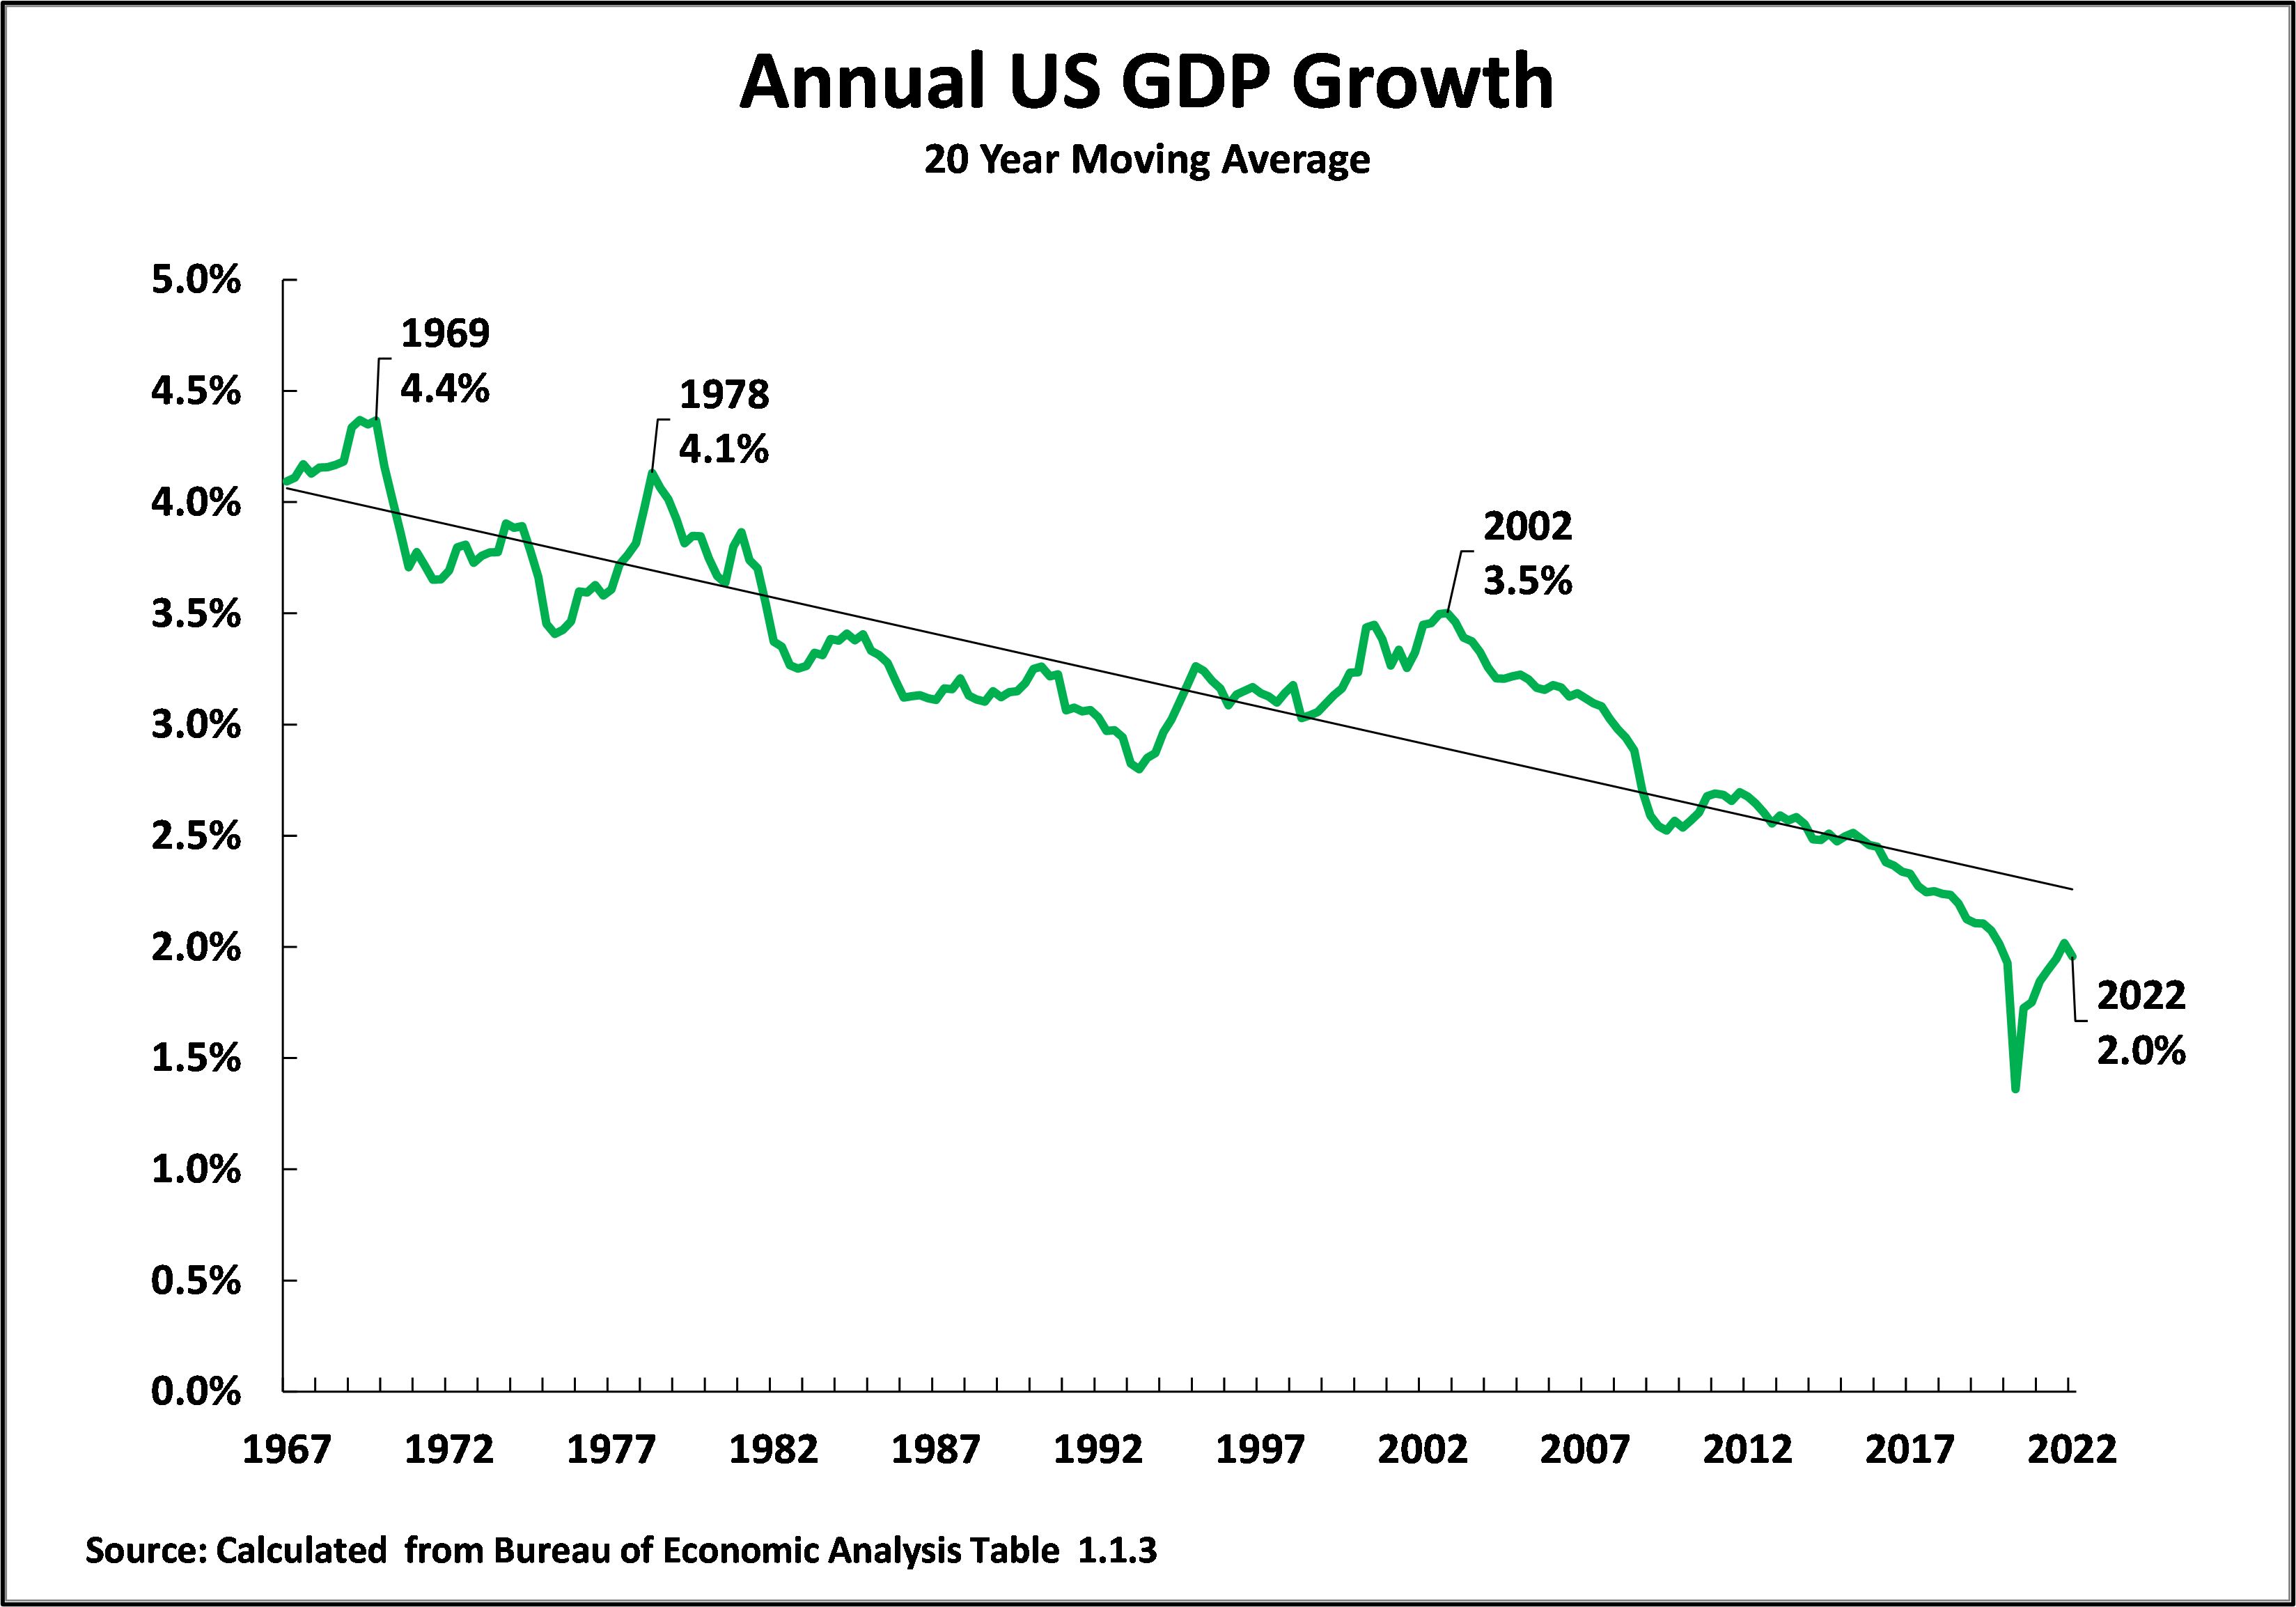
Finally, in analysing the consequences of these structural changes in the U.S. economy, and to place these current problems of the U.S. stimulus packages in context, it is necessary to analyse the longer-term dynamics of the U.S. economy. This is shown in Figure 10. As may be seen, for more than 50 years the U.S. economy has been slowing down. Taking a 20-year moving average, to eliminate the effect of short-term business cycle fluctuations, annual U.S. economic growth has slowed from 4.4% in 1969, to 3.5% by 2002, to 2.0% in the 1st quarter of 2022. Naturally, there were shorter term shifts up and down in this growth, but they were all superimposed on this fundamental long-term slowdown in the U.S. economy.
Figure 10
What explains the slowdown in the U.S. economy?
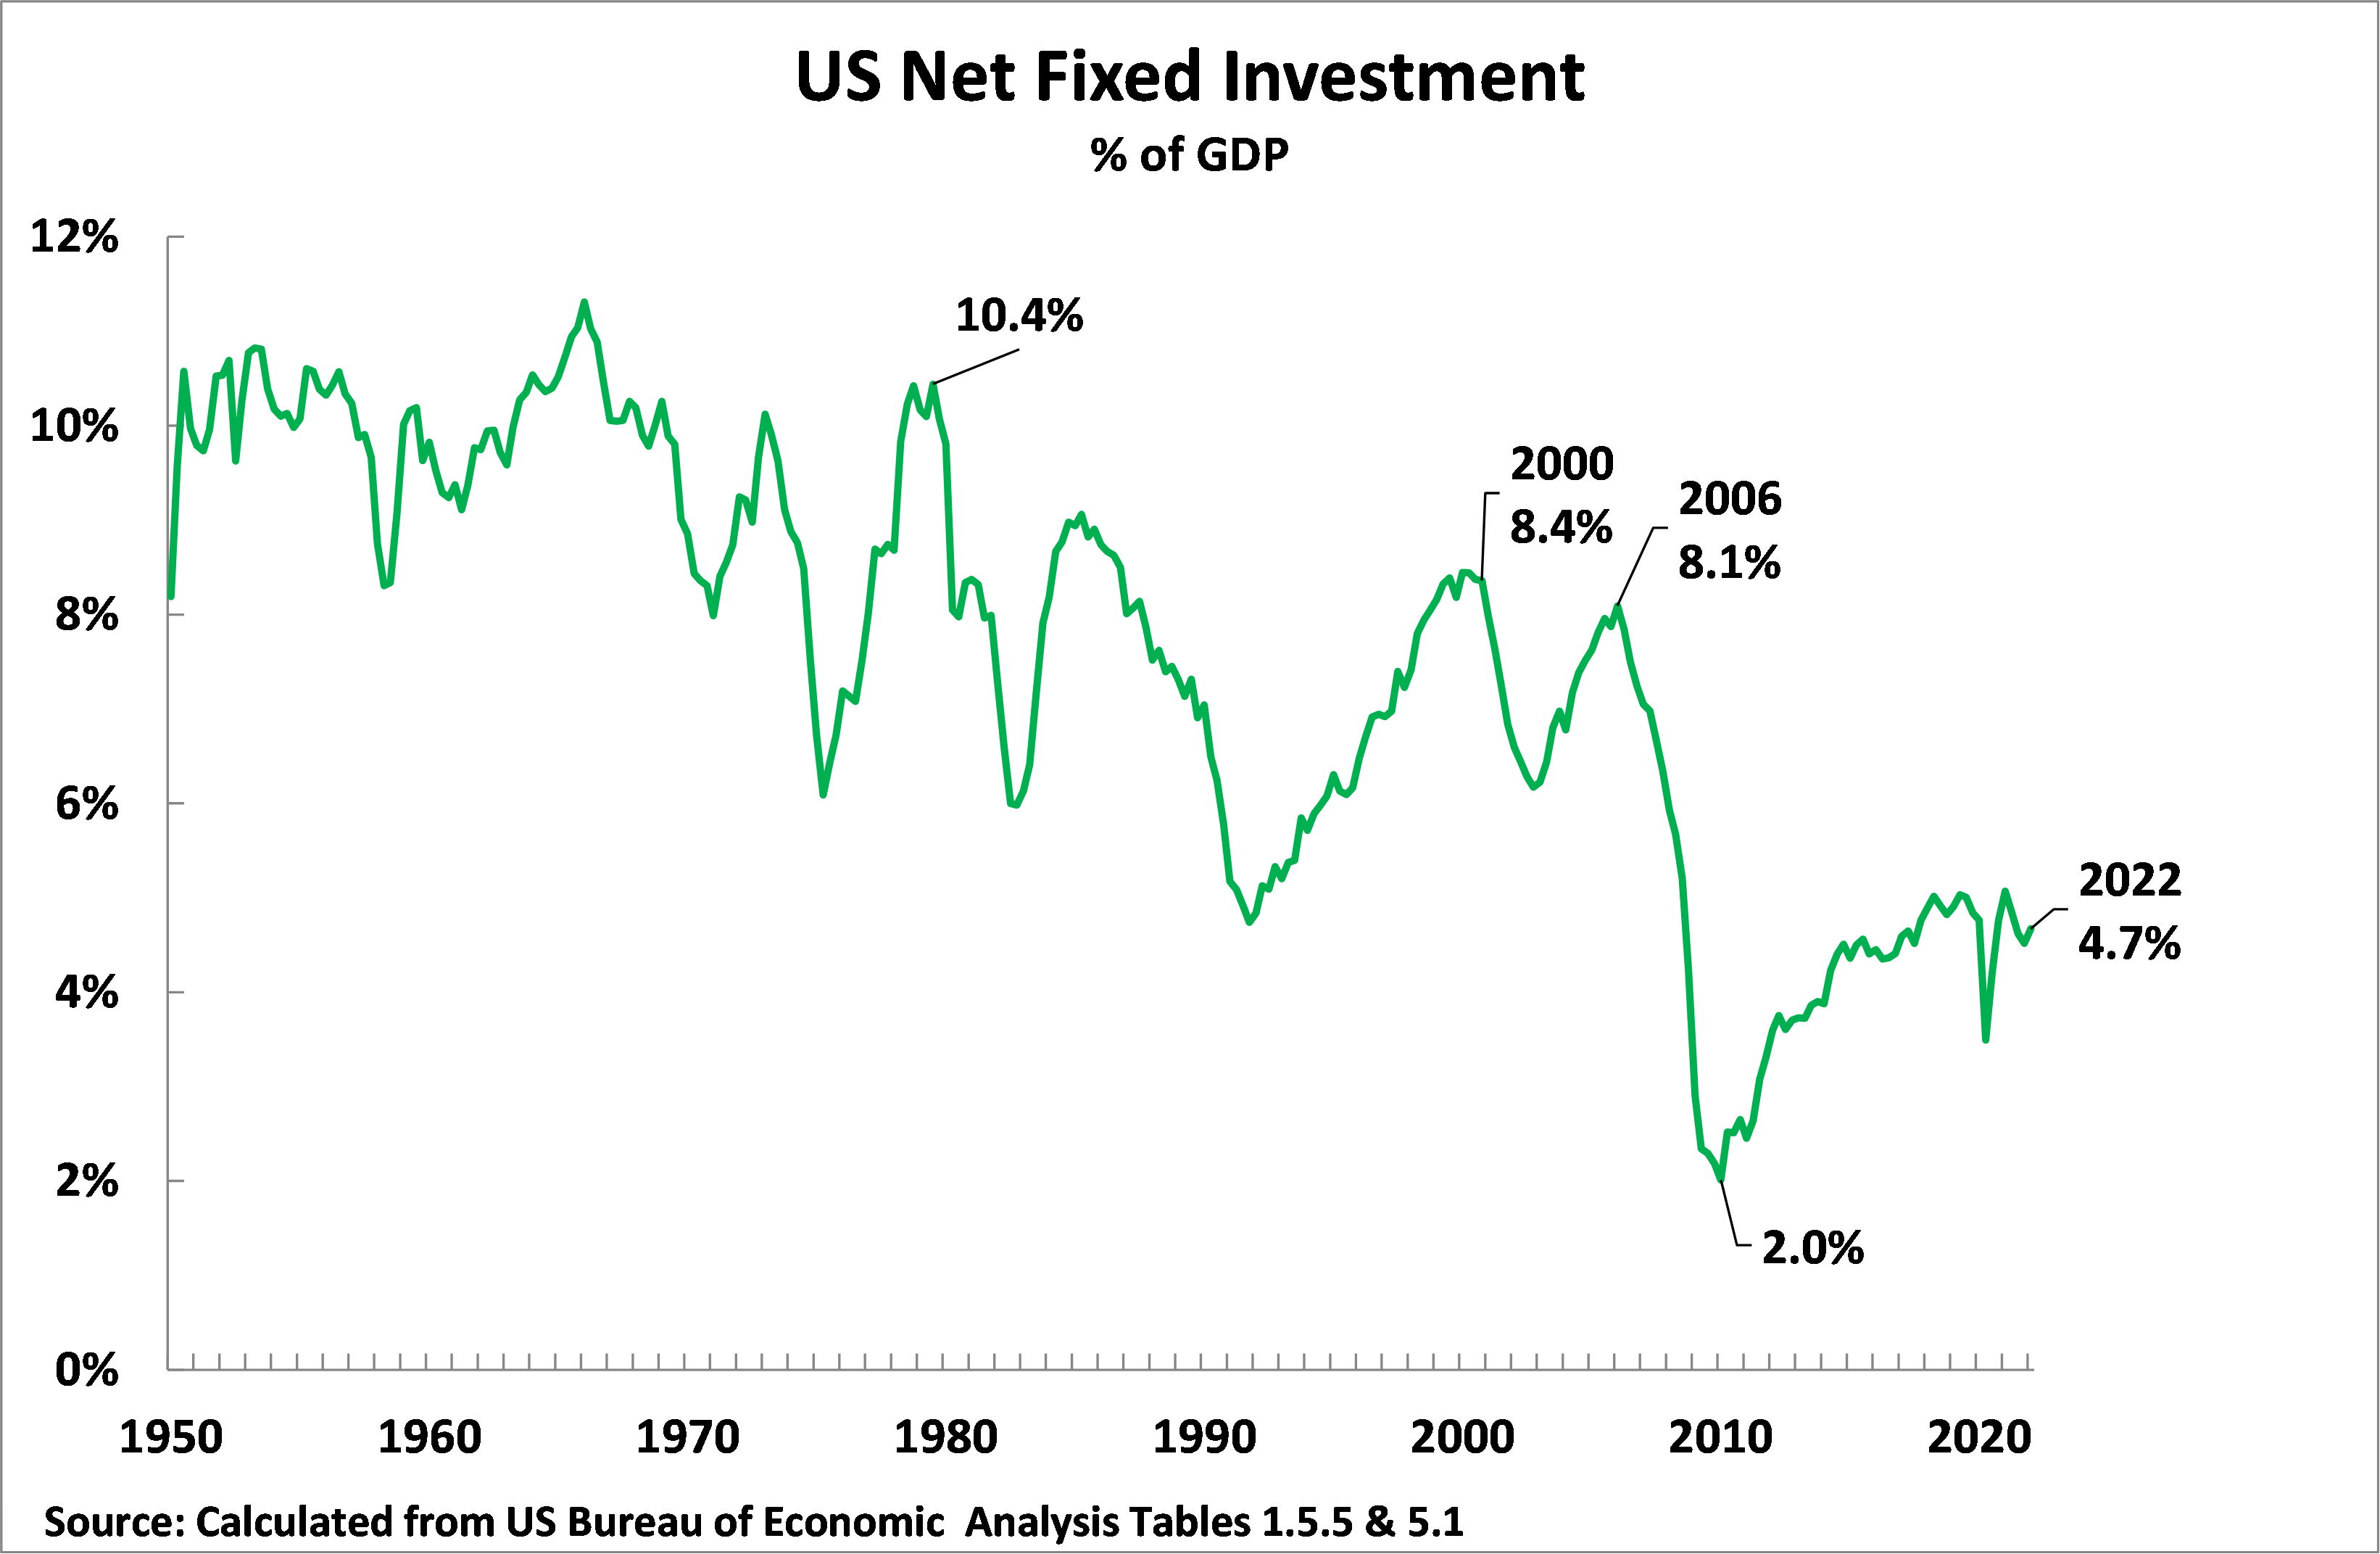
From both the theoretical issues and the correlations analysed above it would be expected that the most powerful factor in this slowdown in the U.S. economy would be created by a fall in U.S. net investment – as this was already shown to have the strongest positive correlation with U.S. economic growth. This is confirmed by Figure 11 which shows the trend in U.S. net fixed investment. The downward trend in the long-term share of net fixed investment in U.S. GDP is clear from this – it has fallen from 11.3% of U.S. GDP in 1966 to 8.1% in 2006 to 4.7% in the first quarter of 2021. This declining share of net fixed investment in U.S. GDP is entirely correlated with the slowdown in U.S. GDP growth already analysed and as was shown in Figure 10.
It is therefore clear that the U.S. Trump/Biden stimulus packages, because they were concentrated on consumption, produced no fundamental increase in the share of net fixed investment in U.S. GDP. Given that net fixed investment has the strongest correlation with U.S. GDP growth these U.S. stimulus packages therefore produced no increase in long term U.S. GDP growth.
Figure 11
The effect on living standards and political stability in the U.S.
Clarifying the relation of consumption and economic growth, and eliminating the confused idea that consumption is an input into production and therefore contributes to GDP growth, has a further immediate consequence. It makes clear why it is necessary to avoid confusion between the two different issues of the rate of growth of consumption and the percentage of consumption in GDP. This has direct consequences both for U.S. economic growth and for the stability, or lack of stability, of the U.S. political situation.
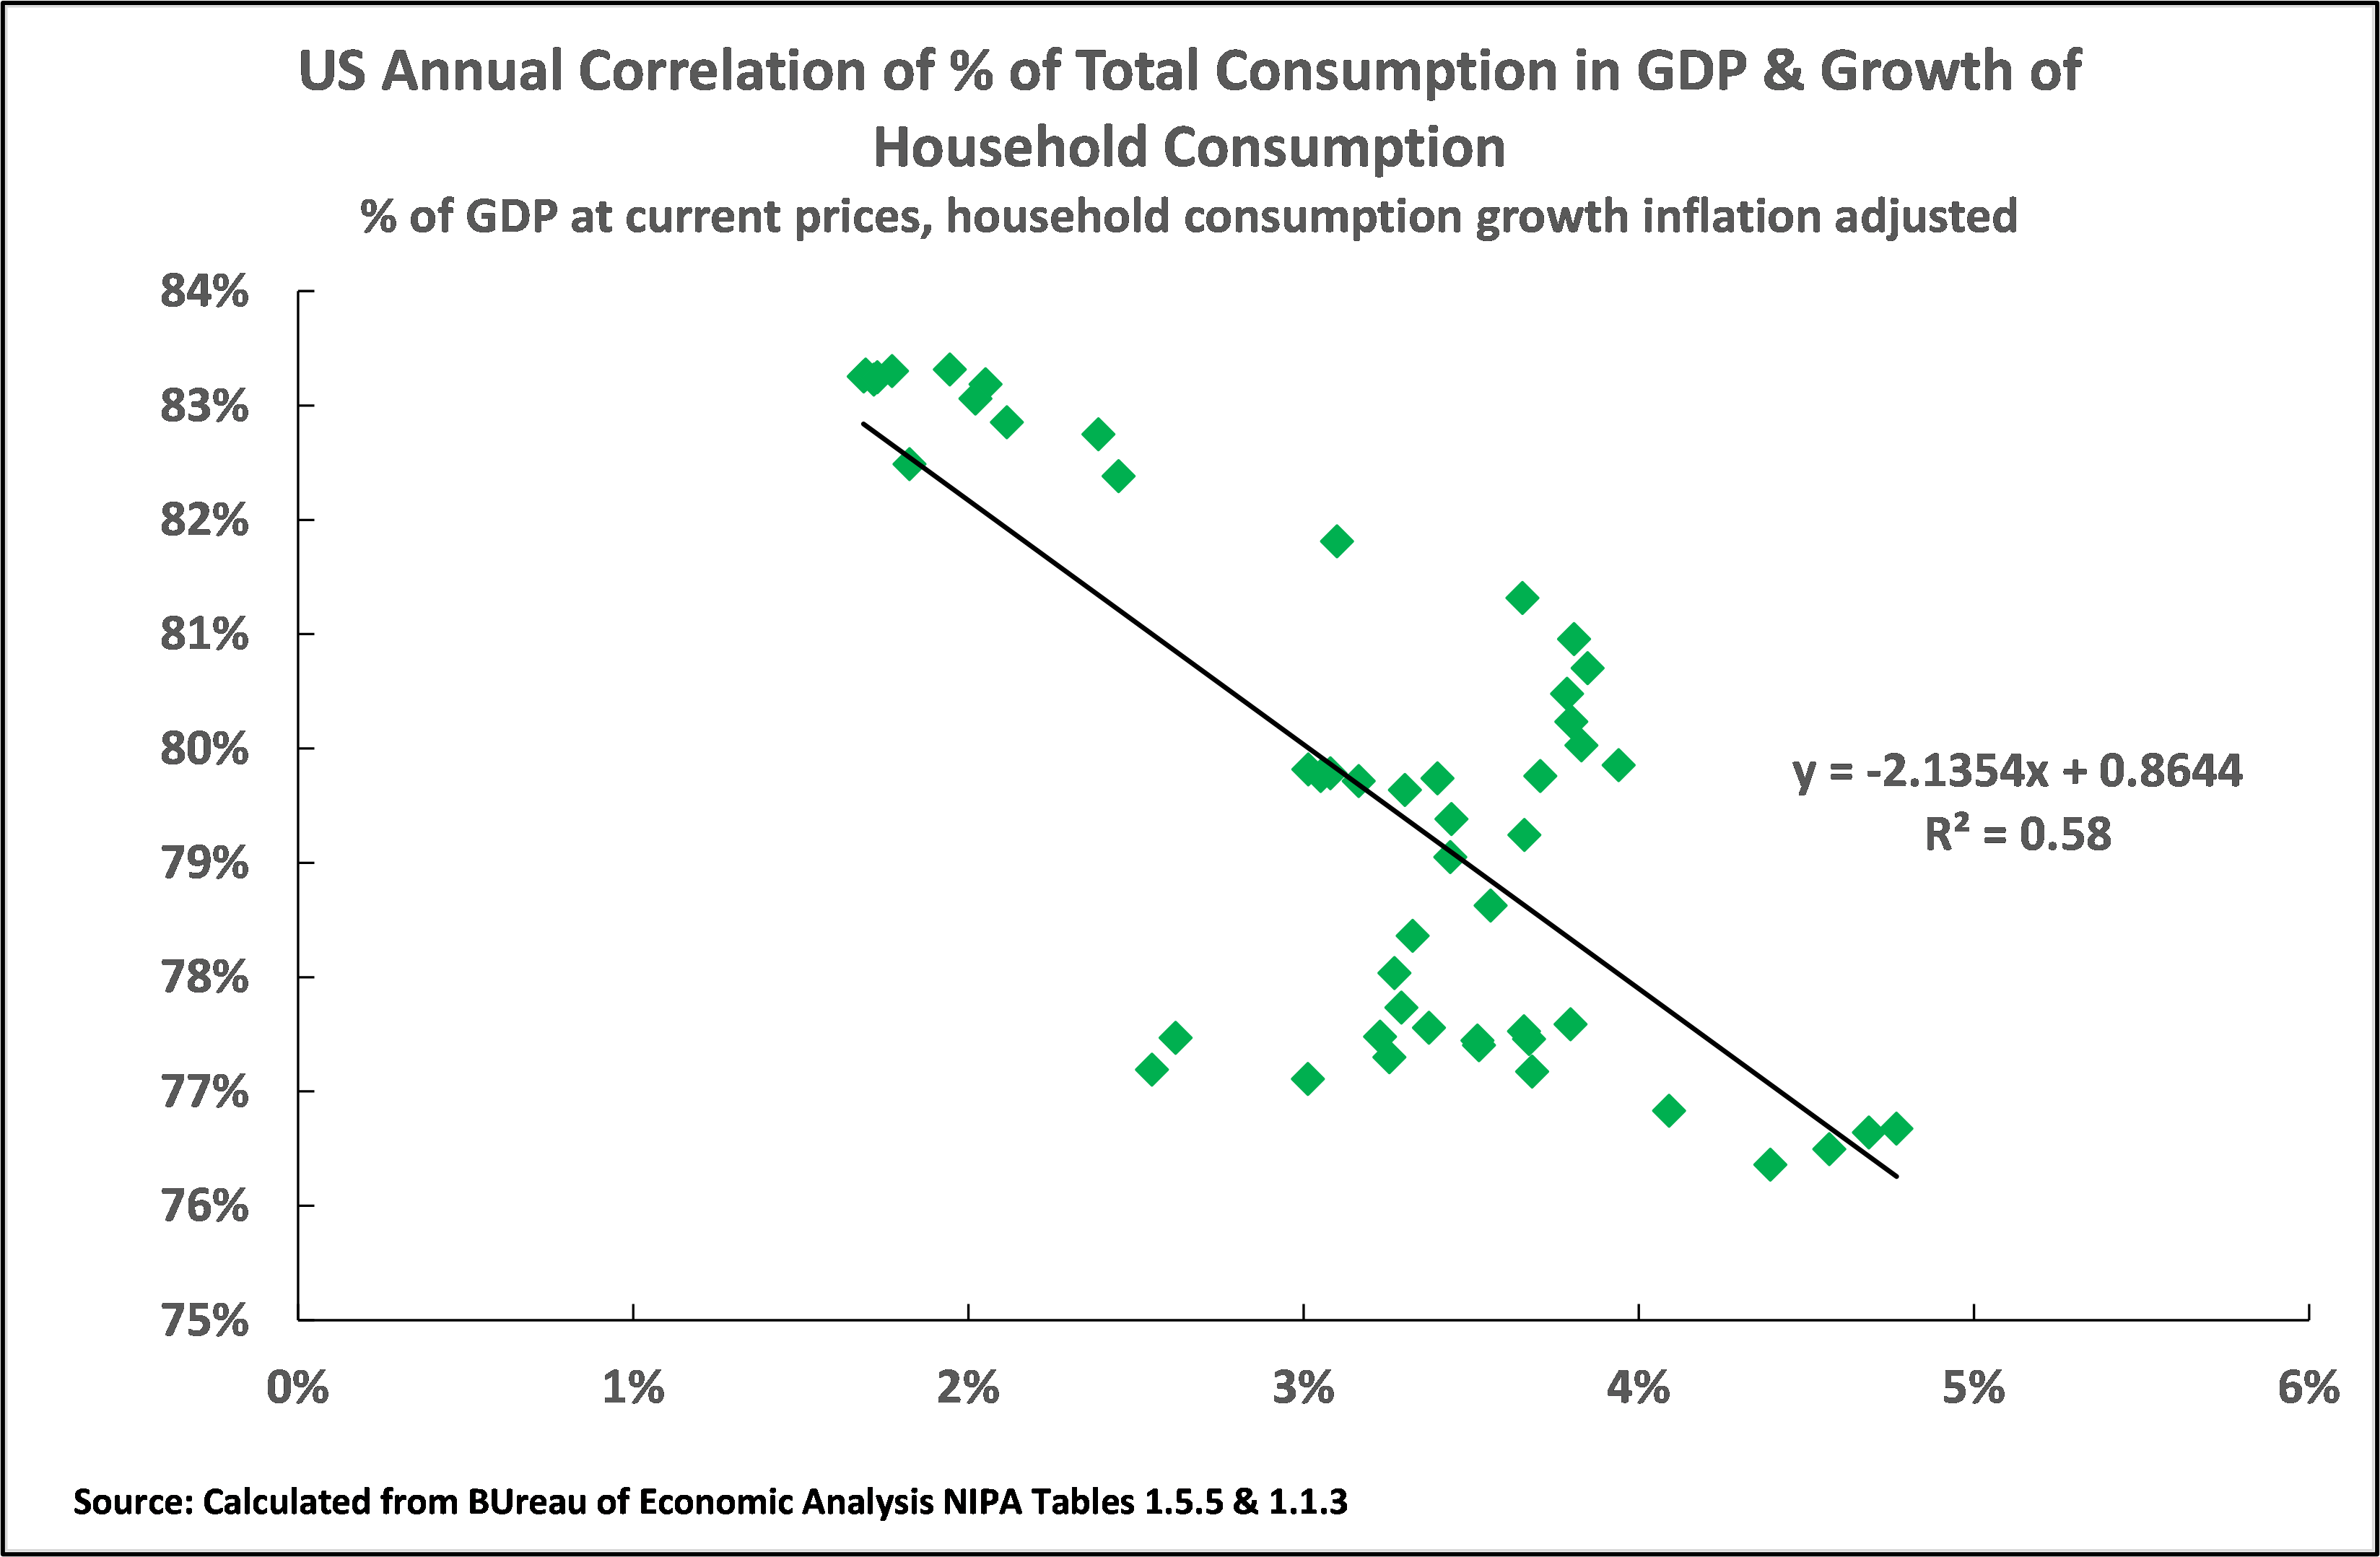
The long-term growth rate of consumption in the U.S. economy is highly positively correlated with overall economic growth in the U.S. economy. But as already show, the higher the percentage of consumption in U.S. GDP the slower is the rate of U.S. economic growth. Other things being equal, therefore, a higher share percentage share of consumption in GDP, by slowing economic growth, will lead to a slower growth rate of consumption. This, again, as will be seen, is confirmed by the factual data as shown in Figure 12. This shows a negative correlation of -0.58 between the share of consumption in U.S. GDP and the annual rate of growth of U.S. household consumption. That is, the higher the share of consumption in GDP the more slowly consumption grows. As the two measures move in opposite directions this makes clear why it is crucial to distinguish between the share of consumption in GDP and the rate of increase of consumption. A higher share of consumption in GDP leads to a lower growth rate of consumption – entirely as would be predicted by economic theory.
But it is the level and rate of growth of consumption, not the percentage share of consumption in GDP, which affects the real lives of people. This is indeed obvious. For example, the country with the highest percentage of consumption in GDP in the world is Somalia, which is also one of the world’s poorest countries with a per capita GDP of $438. Similarly, a country such as the Central African Republic has an extremely high percentage of consumption in GDP, 99%, but is one of the poorest countries in the world, with a per capita GDP of $492 and its per capita consumption has fallen by 15% in the last 10 years. It would be absurd to tell the inhabitants of the Central African Republic that they had a high level of consumption because it is 99% of GDP! What matters to them is their extremely low level of consumption due to the very low level of per capita GDP and the extraordinarily low rate of growth of consumption. This issue, and the necessity to avoid confusion between the share of consumption in GDP and the rate of growth of consumption, directly affects not only the economy but also the political situation – because a lower rate of growth of consumption, that is of living standards, will increase political discontent. For the real life of a population what is crucial is the real level of consumption and its rate of growth – people have no concern with the entirely abstract issue of the percentage of consumption in GDP.
This fact, that there is a negative correlation between the percentage of consumption in GDP and the rate of growth of consumption, that is that the higher the percentage of consumption in GDP the lower will be the rate of growth of consumption, is confirmed in Figure 12.
Figure 12
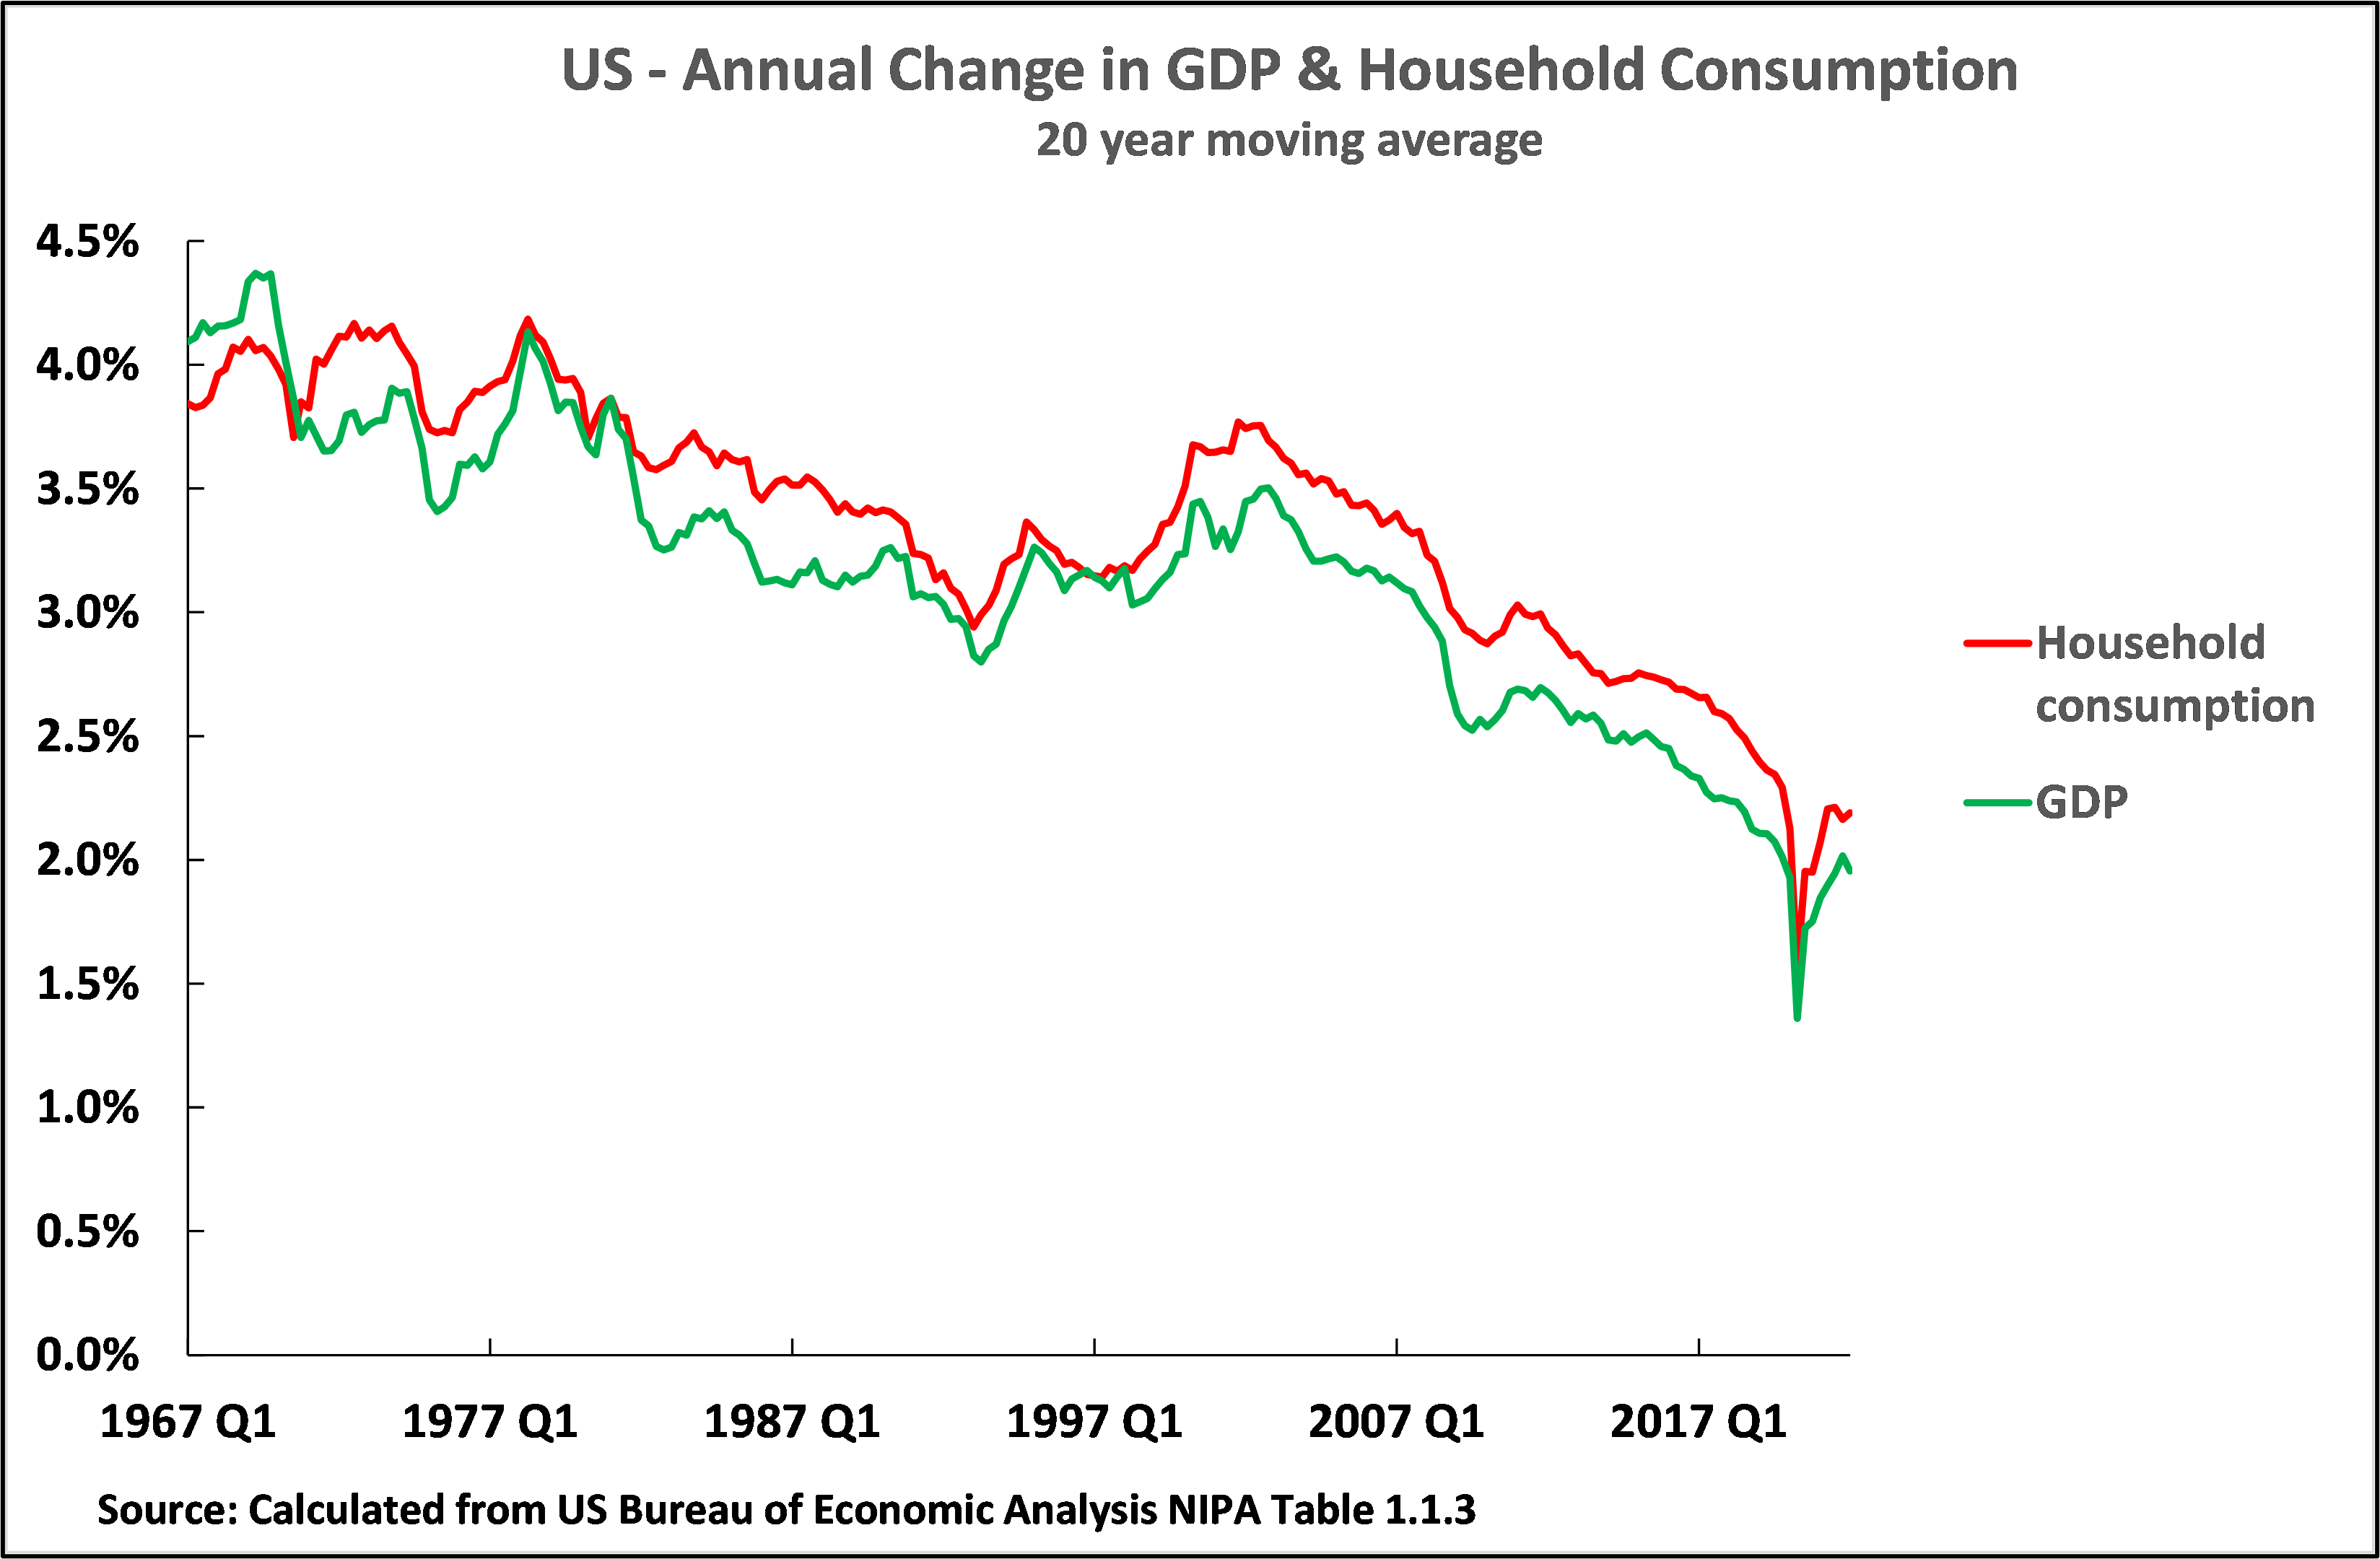
In contrast, there is almost a perfect long-term correlation between GDP growth and growth of household consumption as shown in Figure 13. Taking a 20-year moving average, to remove short-term effects of business cycles, the correlation between U.S. GDP growth and U.S. household consumption is 0.97 – an extraordinarily high figure, leaving no doubt as to the extremely high interrelation between U.S. GDP growth and the growth rate of U.S. consumption.
In summary, an increase in the share of consumption in U.S. GDP will lead to a slower rate of increase of consumption, and a higher rate of growth of GDP will be associated with a higher rate of consumption growth.
Figure 13
Social forces preventing a rise in U.S. investment
So far, conceptual and theoretical confusions in U.S. economic policy have been analysed. But it is evident that such wrong concepts, in order to be turned into wrong policies, must reflect powerful social forces – purely theory cannot produce such powerful economic effects. Why, therefore, is the U.S. willing to launch a very huge stimulus programme focussed on consumption, despite all the problems this causes analysed above, but it does not launch one which includes a major boost to investment?
The answer lies in the capitalist structure of the U.S. economy. A capitalist economy, by definition, is one in which private capital controls the means of production. To launch a large-scale stimulus programme focussed on investment, which would inevitably mean large scale state intervention, would therefore interfere with capitalist control of the economy. The only time in its history the U.S. has therefore launched a truly massive investment led stimulus programme was during World War II – when the total priority of the U.S. was to defeat Japanese militarist and Nazi German aggression.
During World War II U.S. net fixed investment rose to 14.8% of GDP in 1943 – the highest level in US history. Also, by 1944 79% of fixed investment in the U.S. was in the state sector. This state driven investment programme was accompanied by the greatest economic growth in U.S. economic history. Between 1940, the last year of peace, and 1944 the U.S. economy grew by an astonishing 79%, or 15% a year, the fastest short-term growth ever recorded by a major economy in world history.
In summary this state led investment programme was a huge success, but the huge state intervention into the U.S. economy, which was necessary in the deadly struggle against Japan and Germany, produced a decades long shift in the relation of forces in the U.S. against capital and in favour of the working class – the share of wages, compared to profits, in the U.S. economy rose for three decades after World War II and inequality of income and wealth was sharply reduced for the same period. Despite rapid economic growth, and improvement in the living conditions of the population, these political shifts were regarded as undesirable by U.S. capital. Consequently, except in time when it was necessary to avert such mortal peril as in war, the U.S. capitalist class was determined that there would never again be a large-scale state investment programme – even if this resulted in a slow growth of the U.S. economy.
The U.S. capitalist class, despite its anti-Marxist ideology, therefore had a position in practice entirely coinciding with Lenin’s famous dictum that: “politics comes before economics, that is the ABC of Marxism.” Outside of the extreme conditions of war, for example when it was facing a serious but lesser crisis such as Covid, the U.S. capitalist class was prepared to accept consumer based stimulus packages, because they did not interfere with its control of the means of production. But it was not prepared to accept an investment-based stimulus package because experience showed that would make incursions into its exclusive control of the means of production and strengthen the position of the working class.
The erroneous theoretical conceptions regarding consumption already noted, the false idea that consumption can be an input into production, and therefore contribute to GDP growth, was therefore sustained by the interests of U.S. capital – which wished to avoid the policy conclusion that the state should intervene to stimulate investment. But the resulting consumer-based stimulus programmes, which were acceptable to U.S. capitalism, produced the negative economic consequences which have already been analysed.
In socialist China, of course, such a strengthening of the working class is not seen as a problem – which is why China can use both investment and consumption in its stimulus programmes and for the same reasons China can also have a correct conceptualisation of stimulus programmes.
Conclusion
In conclusion, the current destabilisation of the world economy and of the U.S. itself, was due to an interconnected series of profound errors in U.S. economic policy.
- On the conceptual level the mistaken concept that consumption can be an input into production, and therefore a contribution to GDP growth, helped obscure the fact that a huge stimulus to U.S. consumption, with almost no increase in investment, meant a large-scale increase in U.S. demand was taking place accompanied by almost no increase in supply. This combination was bound to be highly inflationary under conditions in which the U.S. economy had little unused capacity. This inflationary wave has destabilised the U.S. domestic and the international economies. Unfortunately, this erroneous concept that consumption can be an input to production, and can therefore contribute to GDP growth, sometimes also appears in China’s media. The extremely damaging consequences of this confusion in the U.S. economy shows why it is important to remove this theoretical error.
- This conceptual confusion reflected the material interests of the U.S. capitalist class – which was prepared to accept a consumption stimulus but did not want any investment led programme as this would have interfered with capital’s control of the means of production. In a capitalist economy, such as the U.S., these interests of the capitalist class prevailed even although they were damaging from the viewpoint of the economy’s development. Fortunately, as China is a socialist economy, the capitalist class does not have the same capacity to block investment being a part of China’s stimulus programmes.
- In addition to the highly inflationary short-term effects of the U.S. stimulus packages they were incapable of producing any long-term increase in economic growth. This was because they produced no increase in the share of the U.S. economy devoted to net fixed investment – which is the factor in U.S. GDP which has the closest correlation with economic growth. Indeed, as a result of the U.S. stimulus packages, the percentage of the U.S. economy devoted to fixed investment fell slightly. Therefore, in addition to their short term negative economic effects the U.S. stimulus packages produced no effects which would increase U.S. long term economic growth.
- There is an extraordinarily high correlation between GDP growth and consumption growth. Therefore, because the U.S. stimulus packages failed to increase the level of net investment, and consequently the U.S. economy remains locked in slow economic growth, the rate of increase of U.S. consumption will remain low. This is in line with the fact that the share of consumption in GDP and the rate of growth of consumption move in opposite directions – the higher the share of consumption in GDP the lower will be the rate of growth of consumption.
- As the share of consumption in GDP and the rate of growth of consumption move in opposite directions, the fact that the Trump/Biden stimulus packages slightly raised the percentage of consumption in the US economy, means that the medium/long term growth of U.S. consumption will be slower.
- The practically important issue for the population is not the abstract issue of the percentage of consumption in GDP but the rate of growth of consumption. Therefore, the slow rate of growth of consumption produces political dissatisfaction and instability in the U.S. That is, the mistakes in U.S. stimulus programmes are damaging not only economically but politically.
In summary, the major errors in both economic theory and practical policy which were involved in the U.S. stimulus programmes have done great damage to the international economy and destabilised the U.S. itself both economically and politically. The facts show clearly that, contrary to propaganda by the United States, it was these serious errors in U.S. economic thinking and policy which were the most fundamental factor in destabilising the world economy, not the Ukraine war.
Formulating correct policies for China, to deal with the current worsening international economic situation, naturally requires a precise analysis of the situation of China’s economy itself. However, some of the theoretical errors, and therefore proposed policies, which led to such damaging results in the U.S. are repeated in the Chinese media. For clarity of policy making, it is therefore necessary to reject these errors to avoid similar problems to the U.S. Analysis of the serious errors in U.S. economic policy, and the reasons for them, is therefore also significant for formulating successful economic policy in China.
Related articles

Why Adam Smith’s ‘classical theory’ correctly explained Asia’s growth

Witnessing at first hand the USSR’s disintegration made me intensely understand the scale of China’s success

The real reason for the US South China Sea provocation

Class and Race in the US Presidential election