An earlier article, “COP26: Why Advanced Countries Must Proportionately Make By Far the Biggest Cuts in Carbon Emissions – Factual Briefing,” analysed the data produced by the Intergovernmental Panel on Climate Change (IPCC) ahead of the COP conference – in its report: “Climate Change 2021: The Physical Science Basis”. The conclusion which follows from the IPCC’s data is clear.
- If a 50% chance of global warming of more than 1.5 degrees from pre-industrial levels is to be achieved, then no more than 500 gigatons of CO2 must be emitted compared to the beginning of 2020.
- Given a world population of 7,708 million, this means there is a future “carbon budget” for each person on the planet of 64.8 tons.
That, in turn, makes it easy to calculate the carbon budget per country – the details of this data for the major carbon emitter countries may be found in the earlier article.
The aim of the present article is to analyse some of the first consequences of this carbon budget of 64.8 tons for each person on the planet. It immediately shows:
- It is absolutely imperative that the most rapid possible reductions in CO2 emissions are made if the world is to stay within its carbon budget.
- But the advanced economies must make proportionately far greater reductions in emissions than the developing economies – at present the advanced economies are not proposing to do so.
In summary the data provided by the IPCC allows precise numbers to be put to the general concept of “common but differentiated responsibilities” which was originally adopted in the Paris Climate Change Accords, and which must be further elaborated by COP26. In particular the overwhelming need for rapid reductions in carbon emissions by the advanced economies is immediately clear.
The factual situation on climate change
As was analysed in the previous article, only 17 countries each account for more than 1% of world carbon emissions, and collectively they account for 75% of world emissions. Therefore, analysis of these 17 countries is sufficient to grasp the key global trends in carbon emissions and climate change. The per capita emissions for these countries are set out in Table 1. This shows that:
- 13 of these countries have higher per capita emissions than the world average and only 4 do not – the latter group being the developing countries of Mexico, Indonesia, Brazil and India.
- Only two relatively small countries, Saudi Arabia and Australia, have (marginally) higher per capita emissions than the U.S.. Per capita emissions of the U.S. are an astonishing 333% of the world average. Only four major carbon emitters – the U.S., Canada, Australia and Saudi Arabia – all advanced economies, have over 300% higher per capita emissions than the world average. These countries are therefore clearly the worst in the world from the viewpoint of per capita carbon emissions.
- In sharp contradiction to U.S. propaganda that it is developing countries, in particular China and India, which are the main problem in fighting climate change, China has per capita carbon emissions only 52% above the world average, and India has per capita carbon emissions 60% below the world average – compared to the U.S.’s per capita emissions of 333% of the world average. China must certainly aim to reduce its per capita emissions, as its government has stated, but China’s per capita emissions are only 46% of the U.S. level. Even more strikingly, India has per capita carbon emissions which are only 12% of the U.S. level. In short, the U.S.’s claim that the main problem in the struggle against climate change is China and India is a pure falsification. It is clearly that U.S., due to its extremely high level of per capita emissions, which is the main obstacle to the fight against climate change among major emitters.
To avoid misunderstanding it should be made clear that the above comparison to the world average are not intended to suggest that the world average of emissions is satisfactory – it is too high as will be analysed in detail below. This comparison is made simply to indicate the relative position of countries. It clearly establishes that it is advanced economies, above all the U.S., which are by far the biggest problem in terms of per capita carbon emissions.
Table 1

The global situation
The world situation flowing from the IPCC data is clear. In order to remain within an average per capita global budget increase of 64.8 tons, by 2030 average per capita emissions must fall to 2.0. tons compared to 2019 level of 4.8 tons. This also means that global equity per capita emissions should converge close to 2.0 tons per capita by 2030. However, because of the much higher starting point of per capita emissions for some countries, primarily advanced ones, at the beginning of 2020, and therefore the fact that they use up their carbon budgets very rapidly at the beginning of the period, very high level per capita emitters in 2020 must reduce their emissions to below 2.0 tons per capita by 2030. This situation for different groups of countries will be examined in detail.
How rapidly will countries use up their carbon budget?
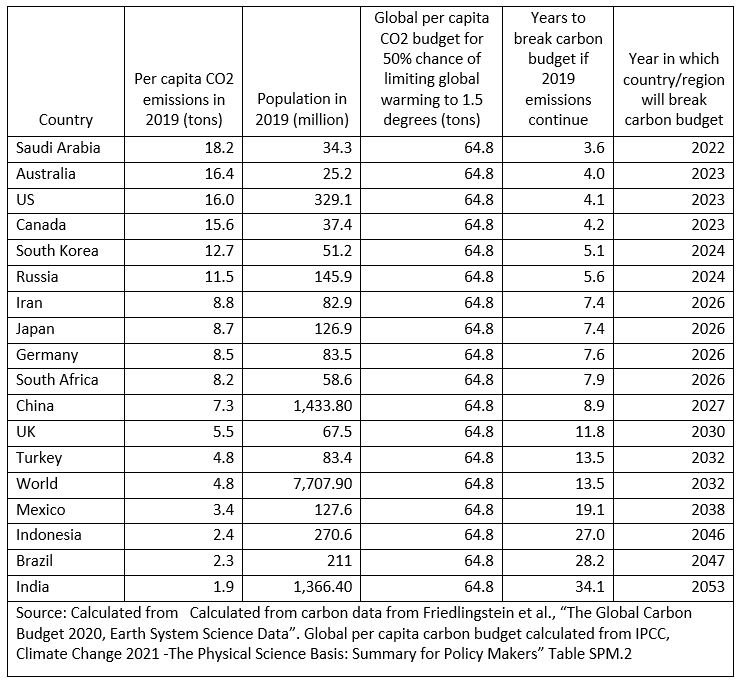
Taking the data from the IPCC report, it is then easy to calculate at what date, taking the global average for per capita emissions, the world and individual countries will use up their carbon budgets to keep global warming to 1.5 degrees below pre-industrial levels. This is shown in Table 2.
The results of this are extremely striking and show clearly why it is imperative that advanced countries extremely rapidly begin to reduce their carbon emissions – and why it is advanced countries that are the proportionately the biggest problem in fighting climate change. Taking countries, based on 2019 emissions, and starting with the worst cases.
- Saudi Arabia will use up its carbon budget in only 3.6 years after 2019 – it will be outside its carbon budget in 2022.
- Australia will use up its carbon budget in 4.0 years after 2019 – it will be outside its carbon budget in 2023.
- The U.S. will use up its carbon budget in 4.0 years after 2019 – it will also be outside its carbon budget in 2023.
- Canada will use up its carbon budget in 4.2 years after 2019 – it will be outside its carbon budget in 2023.
In contrast to these advanced economies, it will take far longer periods for developing countries, and the world as a whole, to go outside their carbon budgets even if 2019 level of emissions were to continue – this latter course is evidently not at all advocated but used to illustrate the factual situation.
- It will take China 8.9 years to go outside its carbon budget even if there was not a reduction from its 2019 emissions level.
- It will take the world 13.5 years to go outside its carbon budget even if there was not a reduction from its 2019 emissions level.
- It will take Brazil 28 years to go outside its carbon budget even if there was not a reduction from its 2019 emissions level.
- It will take India 34 years to go outside its carbon budget even if there was not a reduction from its 2019 emissions level.
This factual data therefore makes clear that by far the most urgent situation in the world is that high per capita carbon emitters – including the U.S., Canada, Saudi Arabia, and Australia – rapidly reduce their carbon emissions otherwise, in a very short period of time, they will go outside their national carbon budgets. It will take far longer for developing countries such as China, and even more so India, to go outside their carbon budgets.
Table 2
The world situation and that for individual countries
Within the above overall framework, it is widely, and rightly, understood that in reality the most crucial period is that up to 2030 – due to the present very high levels of carbon emissions in key counties. There are various methods which can be used to calculate how much carbon emissions must be reduced by 2030 if global warming is not to exceed 1.5 degrees above pre-industrial models.
- Based on detailed models of carbon emissions trajectory, a frequently quoted figure is that a reduction of 45-50% of global carbon emissions is required by 2030.
- This figure, based on the data in the IPCC report, is statistically slightly optimistic – suggesting that the modelling implies more rapid reductions can be made after 2030. Purely statistically, to remain within the global carbon budget on a constant annual reduction basis, a yearly average reduction of world carbon emissions of 7.6% per year is required – implying a 58% reduction by 2030.
However, as will be seen, this difference between modelling and statistical projections is insignificant compared to the differences between individual countries – due to the enormous differences in the current level of per capita carbon emissions between the highest emitters and the lowest emitters.
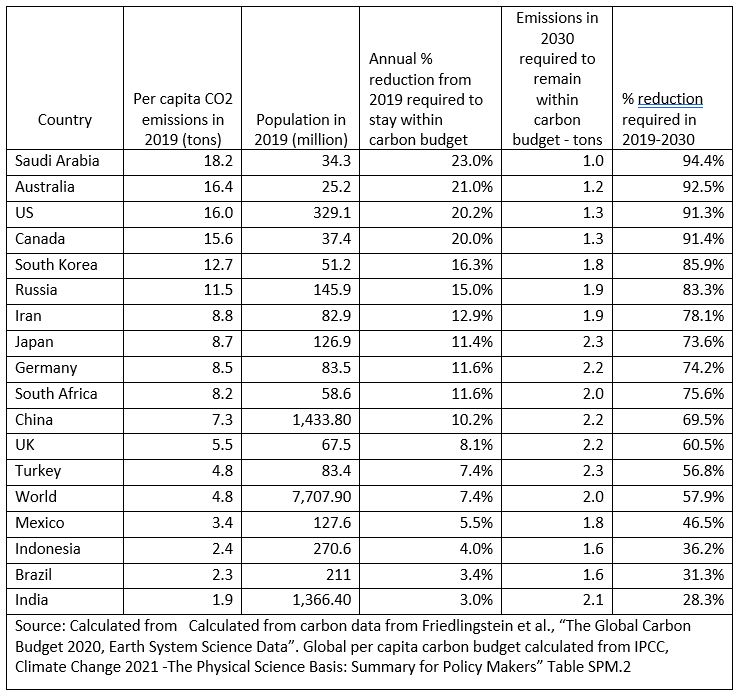
The huge differences in present levels of countries annual per capita carbon emissions, which range between 38.6 tons for Qatar and 0.03 tons for the Democratic Republic of the Congo (a difference of more than 1.2 million percent!) means that the use of a purely global average for reduction of carbon emissions is highly misleading. To take only extreme examples, in fact the U.S.. requires a 91% reduction in per capita carbon emissions by 2030 to be on track to remain within its carbon budget, while India requires only a 28% reduction.
Given that using a purely global average is highly misleading, due to the current far above global average of high emissions economies, of which the most important is the U.S. therefore, here the difference between major emitting countries will be examined. The data is summarised in Table 3 but, to take key cases in more detail, compared to the world statistical average of a 58% reduction by 2030:
- Saudi Arabia, the highest major per capita carbon emitter, requires a 94.4% reduction in per capita carbon emissions by 2030.
- Australia requires a 92.5% reduction.
- The U.S. requires a 91.3% reduction.
- Canada requires a 91.4% reduction.
- South Korea requires an 85.9% reduction
- Russia requires an 83.3% reduction.
- Japan requires a 73.6% reduction.
- Germany requires a 74.2% reduction.
- China requires a 69.5% reduction.
In contrast:
- Indonesia requires a 36.2% reduction.
- Brazil requires a 31.3% reduction.
- India requires a 28.3% reduction.
It should be made clear that these figures are not a detailed modelling of carbon emission projections but indicate the statistical boundaries of average year emissions within which such projections must take place – that means that higher than average emissions during the earlier part of the period must be compensated by larger-than-average reduction during the latter part of the period and vice versa.
This data immediately shows how misleading it is to use the figure of the global average – whether the emissions modelled 45-50% or the statistical average of 58% is used – and then this is applied to individual countries. This is because the starting point in terms of per capita emissions is so divergent between countries. Analysis of individual countries again shows clearly that the advanced economies need to make reductions in carbon emissions by 2030 that are proportionately much greater than the world average. Of the countries that need to make more than 80% reductions five are advanced economies – in descending order of per capita emissions, Saudi Arabia, Australia, the U.S. Canada, South Korea – and only one, Russia. Is a developing economy. In contrast to the supposedly big problems for the fight against climate change according to U.S. propaganda, being China and India, China requires a only a 69.5% reduction and India only 28.3%. In summary, the facts show clearly it is the advanced economies which need by far the greatest and fastest reductions in per capita carbon emissions.
Table 3
Visual presentation
Finally, as some people find it clearer to see a visual presentation of statistical data, Figure 1 illustrates graphically the required average per capita carbon reductions for the most prominent advanced and developing countries – members of the G7 and BRIC groups. As it is rightly stated that the most critical period for emissions is to 2030, Figure 1 illustrates the reductions in carbon emissions that must be made to 2030 by these countries if they are to remain within their carbon budgets. Taking some of the most important of these:
- U.S. per capita carbon emissions in 2019 were 16.0 tons per capita. To remain within its per capita carbon budget, of 64.8 tons of emissions compared to 2019, US per capita emissions must fall by 20.2% a year, meaning that by 2030 they must have declined to 1.3 tons per capita per year. That is a 91.3% reduction compared to 2019.
- Canada’s per capita carbon emissions in 2019 were 15.6 tons per capita. To remain within its per capita carbon budget of 64.8 tons per year compared to 2019, Canada’s per capita emissions must fall by 20.0% a year, meaning that by 2030 they must have declined to 1.3 tons per year. That is a 91.4% reduction compared to 2019.
- Russia’s per capita carbon emissions in 2019 were 11.5 tons per capita. To remain within its per capita carbon budget of 64.8 tons per year compared to 2019, Russian emissions must fall by 15.0% a year, meaning that by 2030 they must have declined to 1.9 tons per year. That is an 83.3% reduction compared to 2019.
- Japan’s per capita carbon emissions in 2019 were 8.7 tons per capita. To remain within its per capita carbon budget of 64.8 tons per year compared to 2019, Japan’s per capita emissions must fall by 11.4% a year, meaning that by 2030 they must have declined to 2.3 tons per year. That is a 73.6% reduction compared to 2019.
- Germany’s per capita carbon emissions in 2019 were 8.5 tons per capita. To remain within its per capita carbon budget of 64.8 tons per year compared to 2019, German per capita emissions must fall by 11.6% a year, meaning that by 2030 they must have declined to 2.2 tons per year. That is a 74.2% reduction compared to 2019.
After these, taking the largest developing economies, which are the particular targets of U.S. propaganda.
- China’s per capita carbon emissions in 2019 were 7.3 tons per capita. To remain within its per capita carbon budget of 64.8 tons per year compared to 2019, China’s emissions must fall by 10.2% a year, meaning that by 2030 they must have declined to 2.2 tons per year. That is a 69.5% reduction compared to 2019.
- India’s per capita carbon emissions in 2019 were 1.9 tons per capita. To remain within its per capita carbon budget of 64.8 tons per year compared to 2019, India’s emissions must fall by an average 3.0% a year.
Figure 1
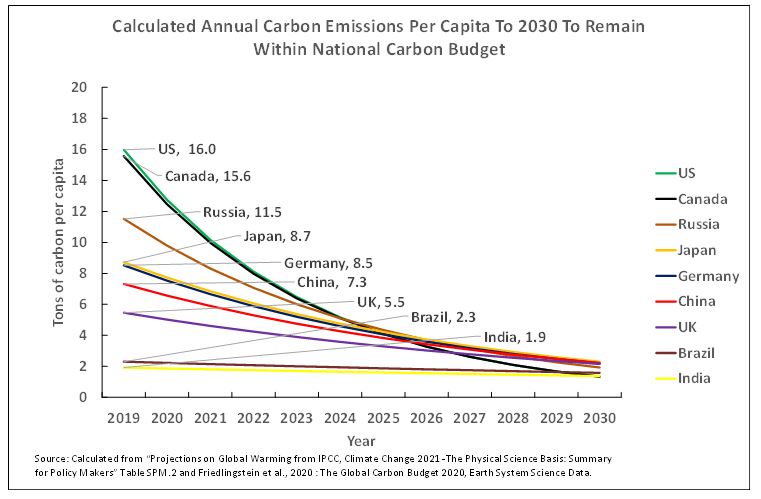
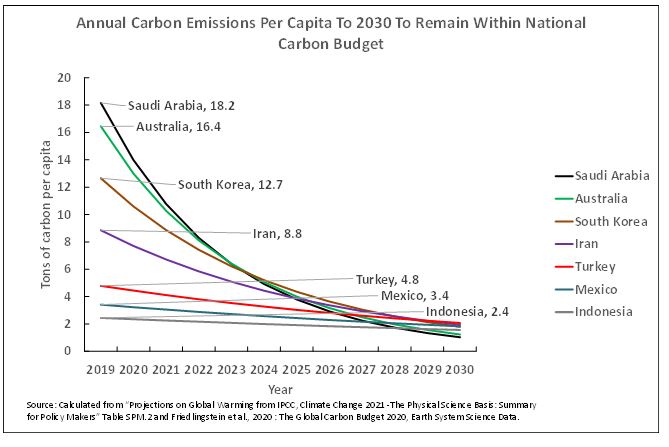
Figure 2 then shows the data for the remaining major emitters which are not members of the G7 or BRIC group of economies. As may be seen by far the most rapid reductions that are required to stay within carbon budgets are in the advanced economies of Saudi Arabia, Australia and South Korea. The lowest reductions which are required are in the developing economies of Iran, Turkey, Mexico and Indonesia.
To take the situation regarding advanced economies
- Saudi Arabian per capita carbon emissions in 2019 were 18.2 tons per capita. To remain within its per capita carbon budget of 64.8 tons per year compared to 2019, Saudi Arabia’s per capita emissions must fall by 23.0% a year, meaning that by 2030 they must have declined to 1.0 tons per year. That is a 94.4% reduction compared to 2019.
- Australia’s per capita carbon emissions in 2019 were 16.4 tons per capita. To remain within its per capita carbon budget of 64.8 tons per year compared to 2019, Australia’s per capita emissions must fall by 21.0% a year, meaning that by 2030 they must have declined to 1.2 tons per year. That is a 92.5% a year reduction compared to 2019.
- South Korea’s per capita carbon emissions in 2019 were 12.7 tons per capita. To remain within its per capita carbon budget of 64.8 tons per year compared to 2019, South Korea’s per capita emissions must fall by 16.3% a year, meaning that by 2030 they must have declined to 1.8 tons per year. That is an 85.9% reduction compared to 2019.
Making the contrast to developing economies
- Mexico’s per capita carbon emissions in 2019 were 3.4 tons per capita. To remain within its per capita carbon budget of 64.8 tons per year compared to 2019, Mexico’s emissions must fall by 5.5% a year, meaning that by 2030 they must have declined to 1.8 tons per year. That is an 46.5% reduction compared to 2019.
- Indonesia’s per capita carbon emissions in 2019 were 2.4 tons per capita. To remain within its per capita carbon budget of 64.8 tons per year compared to 2019, Indonesia’s per capita emissions must fall by 4.0% a year, meaning that by 2030 they must have declined to 1.6 tons per year. That is a 36.2% reduction compared to 2019.
- Brazil’s per capita carbon emissions in 2019 were 2.3 tons per capita. To remain within its per capita carbon budget of 64.8 tons per year compared to 2019, Brazil’s per capita emissions must fall by 3.4% a year, meaning that by 2030 they must have declined to 1.6 tons per year. That is a 31.3% reduction compared to 2019.
Figure 2
The U.S. China and India
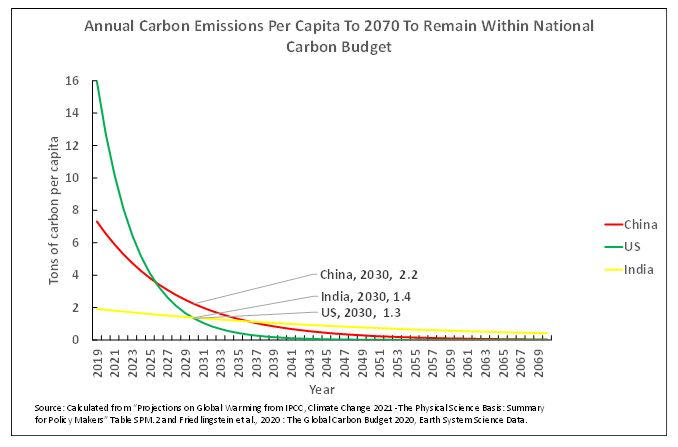
Finally, as China and India are the chief targets of U.S. propaganda, the comparison of these countries will be looked at. The fundamental trend is shown in Figure 3.
As may be seen, because of the much higher U.S. per capita emissions at the starting point in 2019, and therefore in the early period after it, the U.S. will very rapidly use up its carbon budget. To remain within its carbon budget, U.S. per capita emissions must therefore actually be below those of China before 2030 – by 2027 to be precise. U.S. per capita carbon emissions must also fall to below those of India by 2031. This shows how dramatically U.S. carbon emissions must fall.
Figure 3
Conclusion
The conclusions from the data in the IPCC’s report are clear and show the purely propaganda character of U.S. statements. The facts show clearly that it is imperative that carbon emissions are reduced rapidly, but within that framework they show that by far the most rapid proportional reductions must be made by the advanced economies – and in particular by the US.
To make a comparison it might be put the following way. The U.S. is clearly the world’s worst per capita major carbon emitter not only in historic terms, which is relatively well known, but also in current terms. An appropriate comparison might be that the U.S. claim that it is a leader on climate change is rather like the Imperial Wizard of the Ku Klux Klan claiming to be a leader on civil rights! The U.S. attack on China and India, the first of which has per capita carbon emissions 46% of the U.S. and the second of which has per capita emissions 12% of the U.S., is therefore a grotesque frameup. The U.S. is in reality claiming that its (majority white) citizens are entitled to carbon emissions more than twice that of a Chinese person and more than eight times that of an Indian person! It is rather shameful that some sections of the Western movement against climate change have not clearly pointed this out. The facts show clearly it is the advanced economies, in particular the U.S., which must make by far the most rapid reductions in carbon emissions and that their present targets are entirely inadequate.


