- What is the relation between GDP growth and human and social well-being?
- As China’s economic growth is outstanding, with the highest economic growth over a sustained period of a major country in human history, how does China’s overall performance compare internationally in factors affecting human well-being other than economic development?
To aid answering these questions this article makes a systematic international comparison of China with other countries. Such international comparisons clearly reveals the following:
- It is important not to ‘throw the baby out with the bathwater’. The level of GDP, in its effect on per capita GDP, is not only a matter of non-human ‘concrete and steel’ but remains a decisive factor affecting overall human well-being.
- China’s international rankings in factors of human well-being other than economic development are even higher than its achievements in economic development.
Such comparisons immediately settle another question. A new form of the attempt to ‘bad mouth’ China has appeared in the international media and among China’s ‘comprador intelligentsia’. Because attempts to claim China was heading for an economic ‘hard landing’ were shown to be completely false by events in 2016-2017, in parallel with the way they have also always been previously refuted, the new attempt to ‘bad mouth’ China is to claim that China’s social and environmental situation is negative and that this more than outweighs the advantages of achievements of economic growth. This issue will be analysed in detail later, but it may be noted immediately that international comparisons in fact show the reality is the exact opposite to such claims. China’s social situation, in terms of international comparisons, is even higher than that which would be expected from its level of economic development – i.e. from China’s per capita GDP.
These facts are naturally not meant to imply that there are not real and well known social or environmental problems to be tackled in China, as is again discussed later. But it is to give a base for understanding these, to evaluate which problems are normal and any that are abnormal at China’s level of economic development, to see the means necessary to correct problems, and to show in a systematic fashion the distortions, in some cases lies, by China’s comprador intelligentsia.
Finally, as China’s goal is the achievement of a high-income society, an analysis is given of trends among high income economies. Establishing the facts regarding the latter is aimed to aid understanding which high-income societies are most usefully studied to draw both positive and negative lessons.
China’s economic growth
It is unnecessary in this article to repeat in detail the facts of China’s economic growth as these are well known. International comparisons show that China’s growth in the 39 years since the 1978 economic reforms is the fastest sustained economic growth by a major economy in world history. From 1978 to 2016 China’s annual average GDP growth was 9.6% and its economy increased in size by 3,200%. China’s annual average increase in per capita GDP was 8.5% – its per capita GDP increased by over 2,100%. For comparison in the same period US per capita GDP increased at an annual average 1.6% and by a total of 83%. But what, in terms of international comparisons, would be expected to be the effect of such economic growth on social conditions in China and how do these compare to the actual effects?
Life expectancy
It is well known to economists that the best and most comprehensive criteria for judging the overall impact of social and environmental conditions in a country is average life expectancy. Life expectancy sums up and balances the combined effect of all positive and negative economic, social, environmental, health, educational and other trends. Life expectancy is therefore a more adequate measure of social well-being than purely per capita GDP. As Nobel Prize winner Amartya Sen summarized regarding the relation between these different variables:
‘Personal income is unquestionably a basic determinant of survival and death, and more generally of the quality of life of a person. Nevertheless, income is only one variable among many that affect our chances of enjoying life… The gross national product per head may be a good indicator of the average real income of the nation, but the actual incomes enjoyed by the people will also depend on the distributional pattern of that national income. Also, the quality of life of a person depends not only on his or her personal income, but also on various physical and social conditions… The nature of health care and the nature of medical insurance – public as well a private – are among the most important influences on life and death. So are the other social services, including basic education and the orderliness of urban living and the access to modern medical knowledge. There are, thus, many factors not included in the accounting of personal incomes that can be importantly involved in the life and death of people.’
Life expectancy data sums up and balances all positives and negatives – a far more rigorous method than simply seizing on individual factors or anecdotes. In China, for example, to take negatives, it is known pollution is a damaging factor, symbolised by the publicity given to smogs in Beijing and other cities, while to take positives the OECD’s studies show China’s education system is strong in terms of international comparisons, and China’s strong advances in life expectancy after 1949 were correlated in time with great emphasis to primary levels of education and health care.
Factors in life expectancy
Turning to international comparisons, global data shows conclusively that the single biggest factor in a country’s life expectancy is per capita GDP. A long-term analysis of this is given in my book The Great Chess Game (一盘大棋? ——中国新命运解析) so in this article only the latest statistics from the World Bank are analysed – this new data however is fully in line with the longer term trends analysed in The Great Chess Game
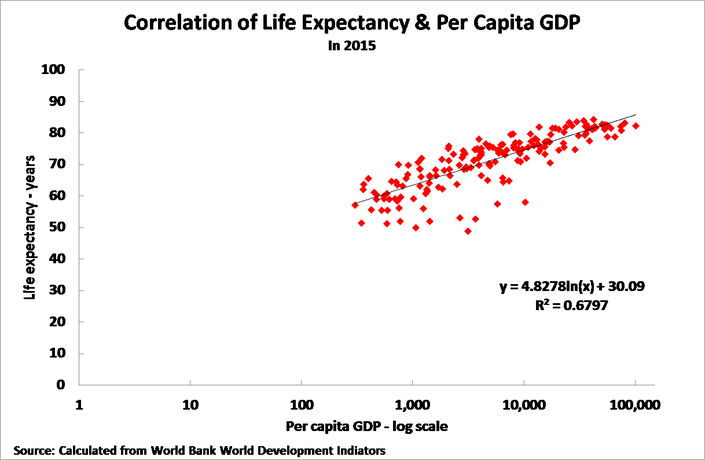
On the latest World Bank data, the level of per capita GDP accounts for 68% of the difference in life expectancy between countries – see Figure 1. The data shows that at any level of income a doubling of per capita GDP adds 3.4 years to a country’s average life expectancy.
Per capita GDP is a life and death question
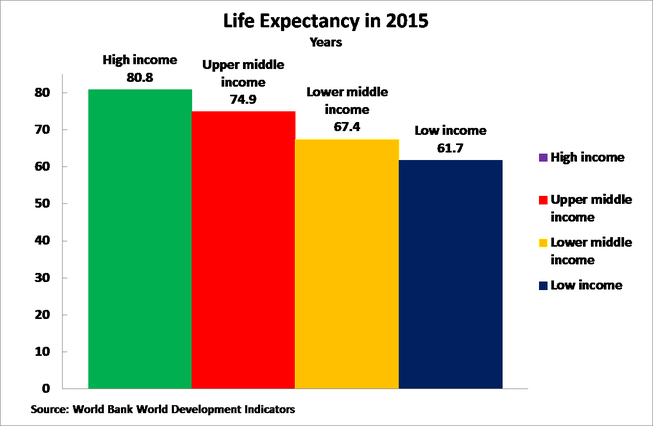
The strong correlation between per capita GDP and life expectancy necessarily means per capita GDP is quite literally a ‘life and death question’. A person in a low-income economy by World Bank classification has a life expectancy of 62 years, whereas someone in a high-income economy has a life expectancy of 81 – a difference of 19 years.
In more detail, as shown in Figure 2, analysing the official World Bank classifications of countries by their level of economic development:
- average life expectancy in a ‘high-income’ economy is 80.8 years;
- life expectancy in an ‘upper middle-income’ economy, the international classification to which China belongs, is 74.9 years.
- life expectancy in a ‘lower middle-income economy’ is 67.4 years,
- life expectancy in a ‘low-income economy’ is 61.7 years.
This data immediately shows why it is necessary not to ‘throw the baby out with the bath water’ in discussions in China of per capital GDP growth. If China were to achieve the average life expectancy of a high-income economy this would be more than five years higher than the average life expectancy of an upper middle-income economy, and almost five years above China’s present life expectancy – with all the improvements in quality of life that would underlie this. Per capita GDP, and therefore GDP, is therefore not ‘socially neutral’. Higher per capita GDP is strongly beneficial in terms of its consequences in social and human well-being. This strong correlation between per capita GDP and life expectancy shows why although GDP is not the aim of social development, it is simply impossible to achieve desirable social goals without high levels of per capita GDP and therefore of per capita GDP growth.
Comparison within countries
It is also significant, and illustrates the processes involved, to note that the difference in life expectancy between countries at different levels of per capita GDP strongly parallels the effects of differences in income within countries. The effect of differences in income within countries has been much studied in advanced economies, as their higher levels of economic development means fairly large sections of the population can achieve high income levels and therefore comparisons of the effects of differences of income affecting large sections of the population can be made.
In the US the richest one percent of men live 15 years longer on average than the poorest one percent of men – while among women the difference is 10 years. Within US cities the differences are even greater. In New York the difference in life expectancy between richer and poorer parts of the city is 11 years, in Atlanta, it is 13 years, in Chicago it is 16 years, and in Philadelphia and Richmond there is a 20 year difference. In the UK in London the difference in life expectancy between the richest and poorest parts of the city is 25 years.
It should be noted that internationally there is no evidence ethnic factors play a substantial role in life expectancy. Of the world’s 10 countries with the highest life expectancy seven are predominantly European in ethnicity (Italy, Spain, Switzerland, Iceland, France, Sweden and Australia) and three are Asian (Hong Kong SAR, Japan and Singapore). The key common feature of these European and Asian countries, of course, is not their ethnicities but that they have high per capita GDPs. It is per capita GDP, not ethnic factors which are decisive in life expectancy.
The data within countries, as well as between them, therefore again confirms that high levels of per capita GDP are not ‘socially neutral’. Due to the strong correlation of per capita GDP and life expectancy, high per capita GDP levels are a necessary condition to achieve long life expectancy.
Non-economic factors
This fact that per capita GDP accounts for 68% of differences in life expectancy between countries, however, necessarily also means that 32% is accounted for by positive factors other than per capita GDP (e.g. good education, good health care, environmental protection) or negative factors other than per capita GDP (e.g. poor education, poor health care, pollution). How well, therefore, is China doing in terms of these other factors? Obviously as per capita income is the largest single factor in life expectancy China, as a developing country, cannot yet match the life expectancy of the advanced economies. But how is China doing compared to countries at a similar stage of economic development?
This can be measured in two ways.
- Because per capita GDP accounts for such a large part of life expectancy it is possible to predict what a country’s life expectancy would be from its per capita GDP.
- A country’s rank in per capita GDP in the world can be compared to its rank in life expectancy. Thus, if a country ranks 60th in terms of GDP per capita but ranks 45th in life expectancy its life expectancy is longer than would be expected from its per capita GDP, but if it ranks 70th in life expectancy then that is lower than would be expected from its per capita GDP.
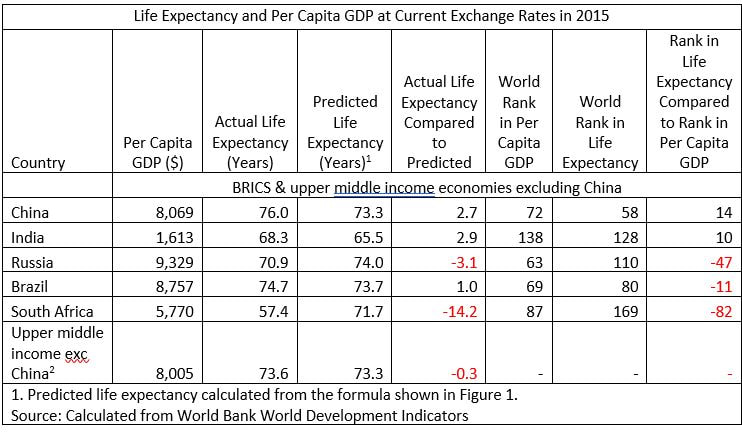
The World Bank supplies data for 183 countries, constituting almost all the world’s population. Both of the comparative measures confirm China’s position is better than would be predicted by its level of economic development, i.e. its per capita GDP. As China, by World Bank classification, is an ‘upper middle-income’ economy’ the relevant comparison, in order to analyse the impact of social and environmental factors other than per capita GDP, is to make a comparison with other upper middle-income economies. This is shown in Table 1 below, which also gives data for the largest group of developing economies – the BRICS. An analysis of the situation with high income economies is also given below.
China’s comparative position
China’s predicted life expectancy from its per capita GDP is 73.3 years but China’s actual life expectancy is 76.0 years, a difference of 2.7 years – that is, people in China live over two and a half years longer than would be expected from its level of economic development. China ranks 72nd in the world in per capita GDP but 58th in life expectancy – that is China’s global rank in life expectancy is 14 places higher than its rank in per capita GDP, indicating that the overall effect of China’s social and environmental conditions is clearly positive.
Making a comparison of China with its direct peer group, that is upper middle income economies by World Bank classification, the average life expectancy for such countries, excluding China itself, is 73.6 years. Life expectancy in China is therefore 2.4 years longer than the average for other upper middle-income economies. The balance of China’s economic and social conditions therefore clearly adds significantly to its life expectancy compared to what would be expected from its per capita GDP.
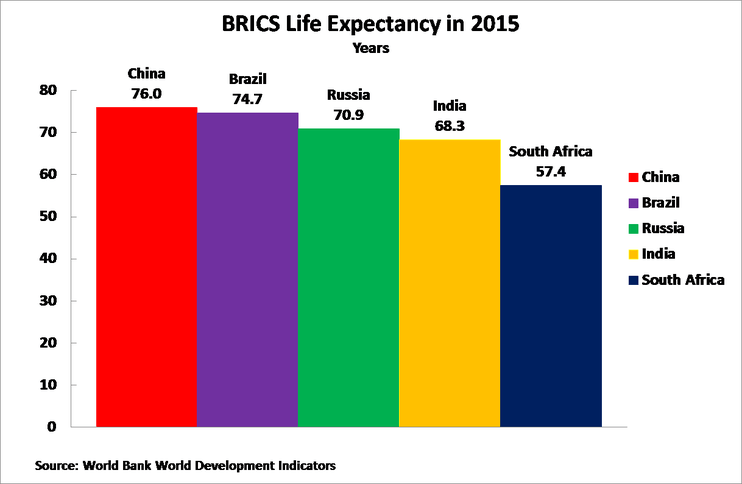
Making a comparison specifically to large developing economies, the BRICS group, Figure 3 shows that China has the highest life expectancy of any BRICS country, despite Brazil and Russia both having higher per capita GDPs than China – all BRICS countries are upper middle-income economies by World Bank classification, except for India which is a lower middle income economy.
As an aside it may be noted that among the BRICS countries India also does well, although not as well as China, while Russia, Brazil and South Africa do badly.
So far trends among developing economies have been analysed. These clearly show China has a significantly higher life expectancy than would be expected from its level of economic development – indicating that the overall effects of social and environmental factors in China are better than the international average and add to life expectancy. Nevertheless, the close correlation between per capita GDP and life expectancy means that it is completely impossible for China to achieve the high level of social and environmental conditions reflected in high life expectancy without a major increase in per capita GDP. This is shown clearly by the fact that no upper middle-income economy has a life expectancy reaching 80 years – the highest is 78 years. In contrast, the average life expectancy of high income economies is 80.8 years – almost five years higher than China’s present level. In short, the most fundamental requirement for China to achieve the social and environmental conditions reflected in high life expectancy is to achieve a substantially higher per capita GDP.
However, while the data show it is impossible for China to achieve high life expectancy without a high per capita GDP, and it is China’s aim is to make the transition to a high-income economy, nevertheless the choices facing China cannot be reduced simply to how to achieve high per capita GDP. The reason for this is that it was already shown that that differences other than per capita GDP can have a significant effect on life expectancy – accounting for 32% of the difference in life expectancy between countries. This reality is also confirmed by examining the situation among high income economies.
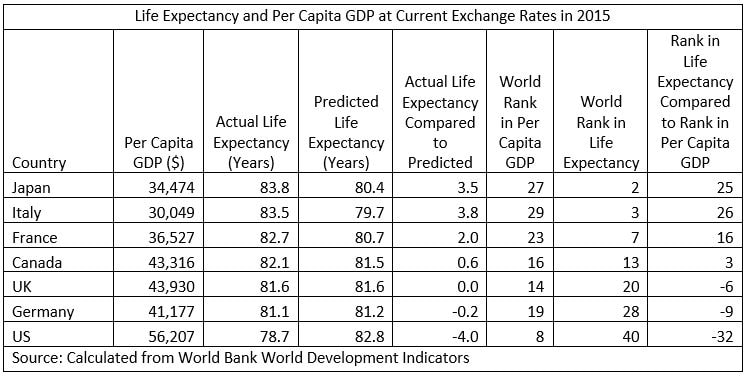
Excluding extremely small countries, whose situation is entirely different to China’s, the effect of social models and other factors among high income economies can be clearly seen. For example in the US life expectancy is 4.0 years shorter than would be expected from its per capita whereas in Spain it is 4.4 years longer. As a result although Spain’s per capita GDP is 54% lower than that of the US, Spain’s life expectancy is 4.6 years longer than the US – 83.4 years in Spain compared to 78.7 years in the US.
Therefore, while a high per capita GDP is a necessary condition for China to achieve a high life expectancy the choice of model of development, and other factors, will have a significant effect on China’s life expectancy. As significant number of high income economies are very small the focus here will be a comparison with large developed economies, the G7, as these are evidently the relevant ones to compare to a country of China’s size.
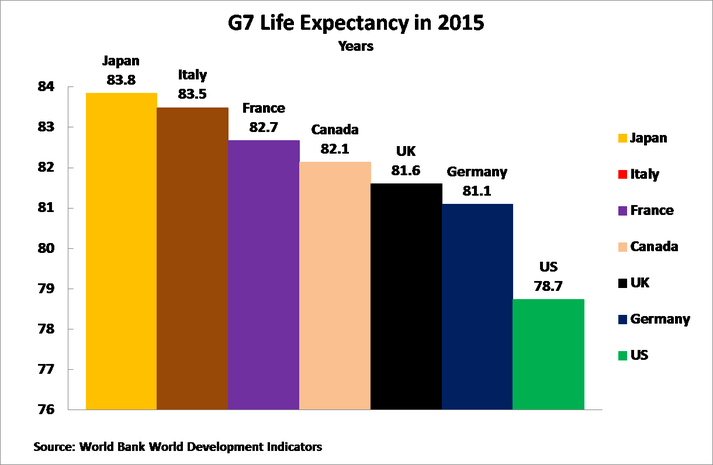
The G7 Figure 4 therefore show life expectancy in the major advanced countries – the G7. This shows an average American has a life expectancy of only 78.7 years – compared to 83.8 years in Japan, 83.5 years in Italy, 82.7 years in France, 82.1 years in Canada, 81.6 years in the UK, and 81.1 years in Germany. The US is the only G7 country with a life expectancy of less than 80.
The G7 countries which have a higher life expectancy than the US all achieve this not by having a higher per capita GDP than the US but by having better social and environmental conditions – shown by their having a rank in life expectancy that is far higher than their rank in per capita GDP. Therefore social, environmental etc. conditions in these countries are far more conducive to a long life than the US despite having lower per capita GDPs. The US performs far worse than any other G7 country.
The fact Americans die earlier than those in the other major advanced economy shows that component parts of the American system – a US health care system which is private, US pollution, US poverty and interlinked ethnic discrimination, the US’s high level of civic violence, and other features mean Americans die far younger than would be expected from the country’s per capita GDP – and younger than in other comparable economies. It turns out the ‘American way’ literally subtracts from the life of Americans. No system which condemns its citizens to an early death could be called ‘the greatest’ as US politicians claim.
In contrast, as already noted, of the world’s 10 countries with the highest life expectancy all have high per capita GDP with seven being in Europe (Italy, Spain, Switzerland, Iceland, France, Sweden and Australia) and three in Asia (Hong Kong SAR, Japan and Singapore). For studying the combination of per capita GDP and non-economic factors these countries are therefore the key ones from which to draw positive lessons. It is therefore clear that if the goal is not highest per capita GDP, but the maximising of social well-being, then the lessons of the US model are negative while the lessons of Europe and some high income Asian countries are positive.
Conclusion
Finally, of course, the method of ‘seek truth from facts’ means this situation has implications for choices for China.
- It was already emphasised that the analysis that the goal of social and national development is not GDP growth is entirely correct. But international comparisons also make clear that without high levels of per capita GDP China cannot achieve its other social goals – as shown by the close correlation of per capita GDP and the measure of overall social conditions shown in life expectancy. Furthermore, this is confirmed not only by international comparisons but by the situation of those of China’s cities which, if they were countries, would already have achieved high-income status by international classification. Shanghai of course has a per capita GDP considerably above the average for China and in in 2016 life expectancy in Shanghai reached 83 years, substantially above China’s national average and higher than the 81.2 years in New York. This trend is also clarificatory as New York’s per capita GDP is still far higher than Shanghai – confirming that as parts of China achieve high income status China keeps its lead in non-economic factors over the US.
- Xi Jinping has stressed that China’s development is ‘people centred’: ‘The fundamental goal of maintaining growth pace and promoting economic development is to seek proper solutions to prominent issues of people’s common concerns.’[1] Given life expectancy key role as an indicator of social well-being it is logical, and in line with China’s emphasis on ‘people centre development’, for China to indicate goals in life expectancy as part of its development strategy. China nationally has set the target of increasing life expectancy by one year during the current 13th five-year plan. To assess situations in regions it may even be appropriate to set regional goals for increases in life expectancy. However, in light of the data given, it is clear any goals in life expectancy must be related to the per capita GDP both nationally and regionally. It should also be noted that international data shows clearly that increases in life expectancy are proportionate to the percentage increase in per capita GDP and not to the arithmetic increase in the amount of per capita GDP. That is, internationally for example, an increase from $5,000 a year per capita GDP to $10,000 per year, that is doubling, will lead to a greater increasing in life expectancy than an increase from $10,000 to $15,000, a 50% increase – although, of course, life expectancy at $15,000 per capita GFP would be expected to be higher than at $10,000 per capita GDP.
- Given the close correlation of per capita GDP and life expectancy, as China’s GDP grows its life expectancy will increase. But it can also be seen from international differences, and from the divergences analysed among high income economies, that choices made by these countries significantly affect their life expectancy. In particular the US model has significantly negative effects on life expectancy. Neo-liberals who urge China to adopt features of the ‘US model’ as China develops – a system based on private medicine, no welfare state etc – have to explain why they believe China should adopt a model which leads to its citizens will dying earlier than in other advanced economies? And if China is to adopt a model in which its citizens are condemned to an earlier death than necessary shouldn’t this be explained clearly to China’s people? Positive examples of the interaction of high per capita GDP with other social factors that increase life expectancy even further may be seen in a significant number of European and Asian countries, whereas in the US, as analysed, non-economic factors significantly shorten life expectancy.
- Finally, it may be noted that the claims by China’s comprador intelligentsia that China’s rapid economic development is more than offset by negative social and environmental conditions is the precise reverse of the truth – China’s social indicators in global comparisons are higher than its economic ones. Far from detracting from China’s situation China’s social achievements add to its economic ones. This naturally does not mean there are not real problems, as with pollution, but that the balance of social benefits and negatives is clearly and strikingly positive in relation to China’s level of economic development – whereas in the US, for example, the balance of social positives and negatives is clearly negative in relation to the US’s level of economic development.
As all these, as has been seen, are literal matters of life and death for people study and accuracy on these issues is vital is vital for China’s goal of people centre development and the overall progress of its people.
Notes
[1] Cited in ‘President Xi says people first in seeking economic growth’ 22 December 2016 http://english.gov.cn/news/top_news/2016/12/22/content_281475522307959.htm


