Blog | 20 Jul 2017
‘Seven charts that show how the developed world is losing its edge’ – a comment on Martin Wolf’s analysis

Earlier this week I finished an article “Growth in the G7 ‘Great Stagnation’ Will be Slower than in the Great Depression“. It was for my column in Chinese at Sina Finance Opinion Leaders. By coincidence, but probably stimulated by similar developments, Martin Wolf, chief economics commentator of the Financial Times, wrote an article for that newspaper on Wednesday with the self-explanatory title ‘Seven charts that show how the developed world is losing its edge’. As we had covered the same subject I wrote a comment on his article which is below.
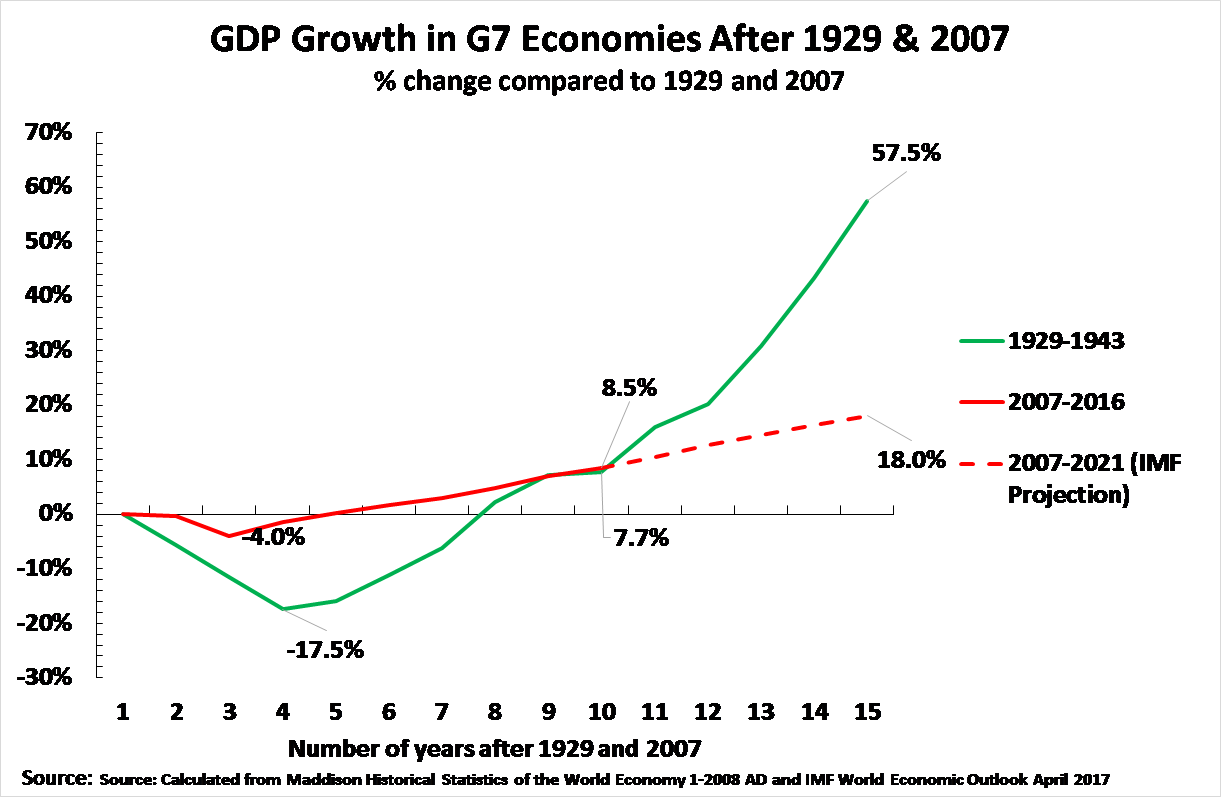
As this blog has an advantage over comments in the FT that it can show charts the key one in my article is shown first.
I hope people will read my article and, for those with a subscription to the FT, they will also read Martin Wolf’s article.
As this blog has an advantage over comments in the FT that it can show charts the key one in my article is shown first.
I hope people will read my article and, for those with a subscription to the FT, they will also read Martin Wolf’s article.
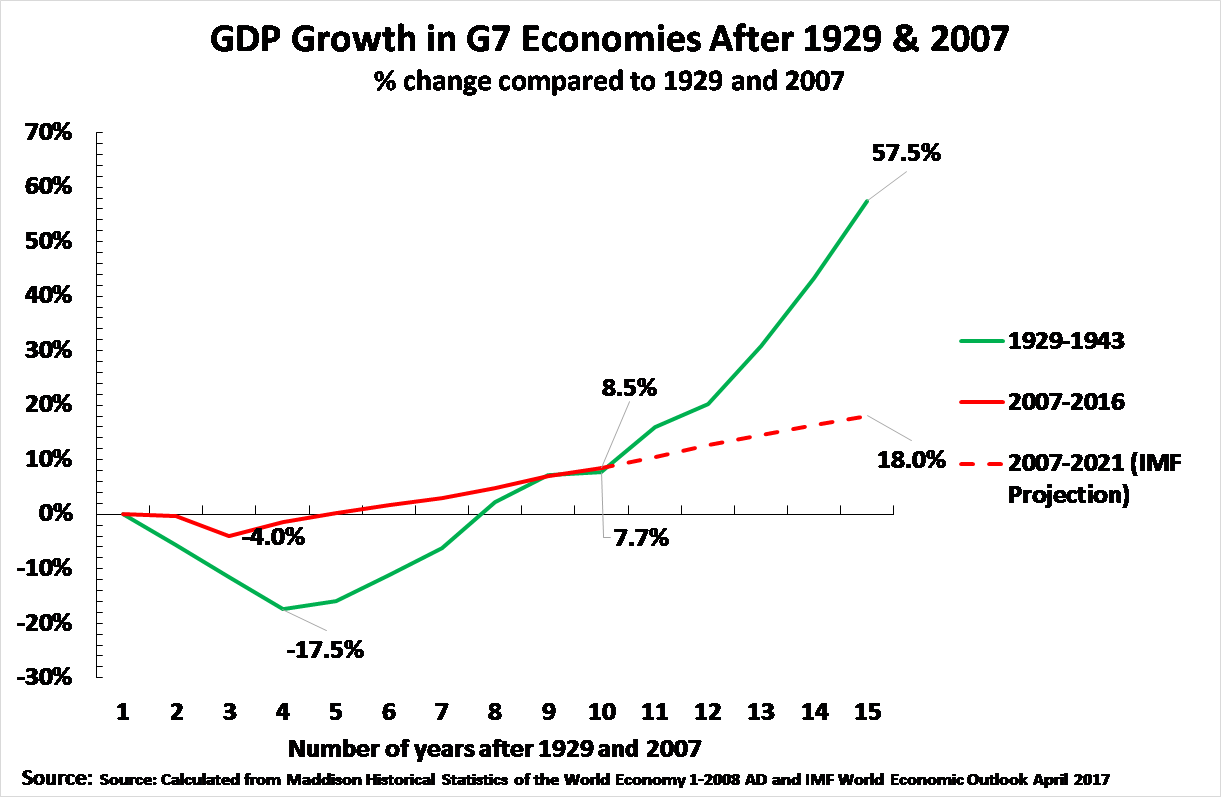
‘Martin as usual put his finger on the big questions. In particular his analysis of the decisive role of China in the 21st century is accurate . But in one key sense he even underestimates the situation of ‘stagnation’ in the advanced economies. Data shows that growth in the advanced economies will actually be slower than in the Great Depression after 1929. This can be immediately seen in a chart which can be found at ‘”Growth in the G7 ‘Great Stagnation’ Will Be Slower than in the Great Depression“. However as charts cannot be posted here [in FT comments] the data may be summarised in words.
‘After the initial post-1929 economic collapse recovery during the 1930s was rapid and post-crisis growth strong – the US being the most important exception. By a convenient statistical coincidence, 1938 was nine years after 1929, and 2016, the most recent year for current factual data, was nine years after the last pre-international financial crisis year of 2007. Therefore, in comparing 1929-38 with 2007-16 the same length of time is being analysed. By 1938, nine years after the beginning of the Great Depression, G7 output was 8.5% above its 1929 level and in 2016, nine years after 2007, G7 growth was 7.7% above its pre-financial crisis level. By 2016 growth of the Western economies after the international financial crisis was therefore almost as slow as in the Great Depression. But strikingly growth during the recovery period in the Great Depression was much faster than after the international financial crisis, so already by the end of this year overall growth after 2007 will be slower than after 1929 – G7 growth in the 10 years after 1929 was 15.9% and by 2017, 10 years after 2007, it will be 10.6% on IMF projections. This does not contradict Martin’s point, merely puts it more starkly.
‘As regards China this point made by Martin is decisive and its implications need to be internalised: by all analysis: ‘Nothing better illustrates China’s advance than its huge savings. These are so large, partly because the economy has become so big and partly because Chinese households and businesses save so much. It is likely that Chinese capital, capital markets and financial institutions will become as influential in the world economy in the 21st century, as US capital, capital markets and financial institutions were in the 20th century.’


