Blog | 02 Feb 2018
New turbulence on US financial markets shows the limits on US growth under Trump
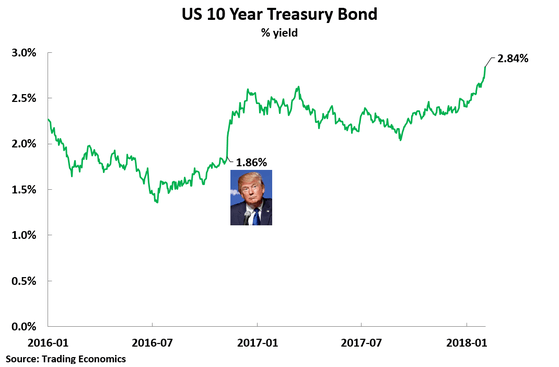
- The driving force was the continuing sharp rise in US Treasury Bond yields, that it the interest rate on US Treasuries, which has risen from 1.86% when Trump was elected to 2.84%. US Treasury rates set the floor for all long term US interest rates and are far more important for US economic trends than the shifts in Federal Reserve interest rates.
- Simultaneously US jobs data was released showing that wages in January had risen by 2.9% compared to a year earlier – seen as an indicator of inflationary pressure in the US.
- Meanwhile commodity prices, as measured by the S&P GSCI index had risen by 10.6% compared to a year earlier – adding to inflationary pressures in the US.
- This helped precipitate a 2.1% fall on 2 February on the S&P500 – the most severe daily decline since Trump was elected.
In summary the US economy was showing clear signs of rising interest rates and rising inflation – producing the market turmoil.
It is important to understand that these trends are not separate. They show that although US economic growth is low by historical standards, with only a 2.5% year on year GDP increase in the year to the 4th quarter of 2017, it is showing signs of overheating:
- Interest rates are the price of capital, and the sharp rise in interest rates shows that the supply of capital in the US is smaller than the demand for it,
- Inflation shows that supply of goods and services, including labour, is smaller than the demand for it.
In summary, despite low growth, the US is showing signs of capacity constraints.
By coincidence on the morning of the same day an article by me analysing the latest US economic data was published. This clearly predicted these trends – although it was of course written before the events on 2 February. This article is published without change below except for an updating of the US bond yields data to the end of 2 February.
The new release of US and EU GDP data for the whole of 2017 allows a factual examination of the latest state of the US economy and constitutes a baseline for assessing the future impact of the Trump tax cuts. This new data confirms the following fundamental features of US economic performance.
- In 2017, for the second year in a row, the US was the slowest growing of the major economic centres – behind not only China but also the EU.
- In the last quarter of 2017 the US continued to undergo a purely normal business cycle upturn from its extremely bad performance in 2016
- There was no sign of an improvement in the fundamental economic structure of the US economy that would permit significantly accelerated growth in the medium/long-term.
- Therefore, the perspective is that the US will undergo a cyclical upturn in 2018 before encountering capacity constraints that will again slow its economy in 2019-2020 – the symptoms of these capacity constrains are likely to be increasing interest rates and rising inflation.
This situation of the US economy has significant implications for US-China relations. In particular, as the US is unable to speed up its medium/long term growth, those forces in the US seeking to engage in ‘zero-sum game’ competition with China can only achieve their goal of improving the position of the US relative to China by trying to slow China’s economy.
These implications will be considered in the conclusion of the article. However, first, using the approach of ‘seek truth from facts’ the latest data on the US economy will be examined.
US was again the most slowly growing major economic centre
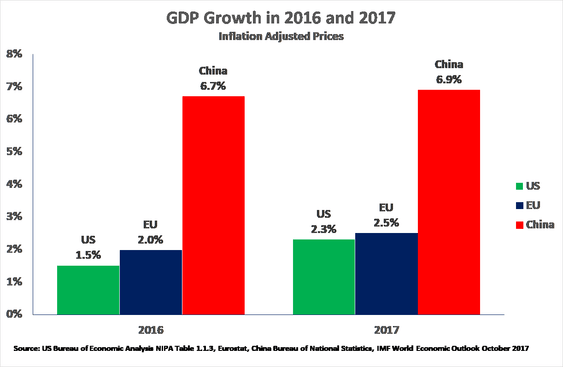
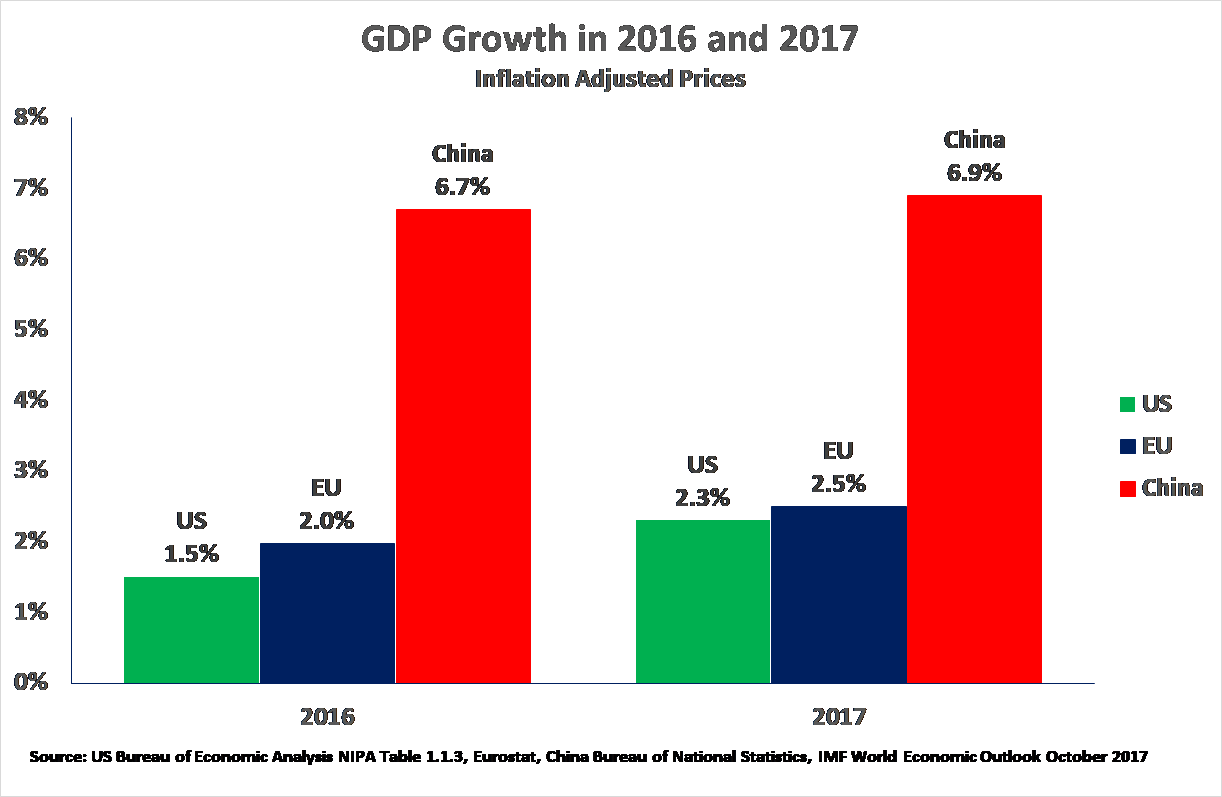
The new data shows that for the second year in succession the US was the world’s most slowly growing major economic centre – see Figure 1:
- In 2016 US economic growth was 1.5%, EU growth 2.0%, and China’s growth 6.7%
- In 2017 US economic growth was 2.3%, EU growth 2.5% and China’s growth 6.9%
This data shows that the claim in sections of the Chinese media that in the last two years the US was undergoing ‘dynamic growth’ was entirely false, the opposite of the truth. Bluntly it was in the category of ‘fake news’.
In addition to the data for the whole of 2017, in the year to the 4th quarter of 2017 the US was still the slowest growing major economic centre – US growth was 2.5%, EU growth 2.6%, and China’s growth 6.8%.
Although the facts of US poor economic performance in 2017 and 2016 are therefore clear this clearly poses a question. To what degree will the US improve this performance? This in turn requires examining both the position of the US in the present business cycle and the medium/long term determinants of the US economic performance.
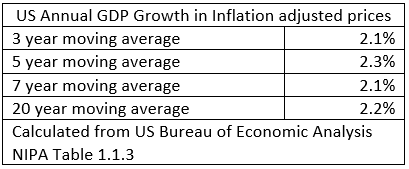
In order to separate purely cyclical short-term movements from medium/long term fundamental trends in the US it should be noted that the medium/long term growth of the US economy is one of the world’s most predictable. Analysing the latest data, which go up to the 4th quarter of 2017, Table 1 shows that the three-year moving average of US annual GDP growth is 2.1%, the five-year moving average is 2.3%, the seven-year average is 2.1%, and the 20 year average is 2.2%. Only the 10-year moving average shows a significantly lower average – due to the great impact of the post-2007 ‘Great Recession’. Given that medium and long-term trends closely coincide the US fundamental medium/long term growth rate may therefore be taken as slightly above 2%.
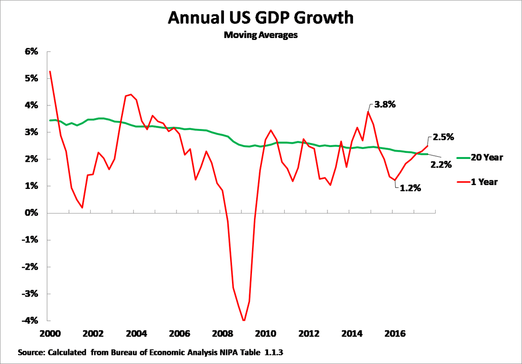
In addition to showing 2.5% year on year growth for the latest quarter, Figure 2 shows that US annual average GDP growth was below its long-term average of 2.2% for six quarters from the 4th quarter of 2015 to the 1st quarter of 2017. Therefore, merely to maintain the US average growth rate of 2.2%, US growth would be expected to be above its 2.2% average growth rate for a significant period after the beginning of 2017. Figure 2 shows this is occurring, with US growth in the third quarter of 2017 being 2.3% and in the last quarter of 2017 reaching 2.5%. Therefore, the acceleration of US growth in the last quarter of 2017 was a normal business cycle development and did not reflect an acceleration in US medium/long- term growth.
More precisely, given the prolonged (6 quarters) period centring on 2016 when US growth was below its long-term average, this also means that purely for normal business cycle reasons it would be anticipated that for most of 2018 US GDP growth would be above its long-term average of 2.2%. This may allow US growth to overtake that of the EU, but not of course to overtake China. But there is as yet no indication that the US economy will achieve sustained growth of more than three percent growth rate claimed by Trump’s Treasury Secretary Cohn who stated to CNBC in justifying the tax cut that: ‘We think we can pay for the entire tax cut through growth over the cycle… Our plan was based on a 3 percent GDP growth. We think we can now be substantially above 3 percent GDP growth.’
It should be noted that Cohn’s claim is that three percent growth can be achieved over a business cycle – which would indeed be a substantial increase in US medium/long term growth. It is not at all the same as the US achieving three percent growth in a particular quarter or quarters – which has occurred previously and is entirely compatible with the maintenance of the current US medium/long term growth rate of just above 2.2%.
There is, of course, even less evidence that the US economy will achieve 6% growth as claimed by President Trump in his December press conference with Japanese prime minister Abe.
In order to asses the realistic growth rate for the US it is now necessary to analyse the fundamental determinants of US medium/long-term growth.
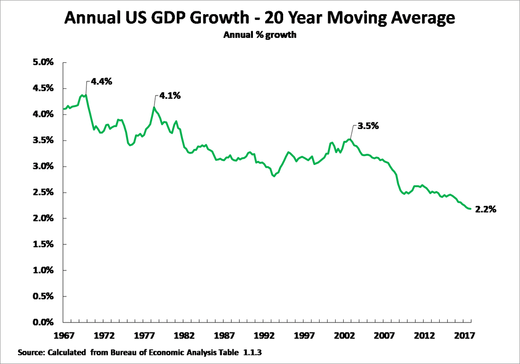
The most fundamental trend in US long term growth is the progressive slowing of the US economy which has been taking place for over 50 years. Figure 3 shows that, taking a 20-year moving average, to remove all short-term effects of business cycles, the US economy has progressively decelerated from 4.4% annual growth in 1969, to 4.1% in 1978, to 3.5% in 2002, to 2.2% in the 4th quarter of 2017. The fact that the US economy has been slowing for over 50 years shows that this process is determined by extremely powerful and long-term forces which will, therefore, be extremely difficult to reverse. The nature of these trends is analysed below – the latest US data, however, clearly shows no acceleration in long-term US growth which remains at 2.2%
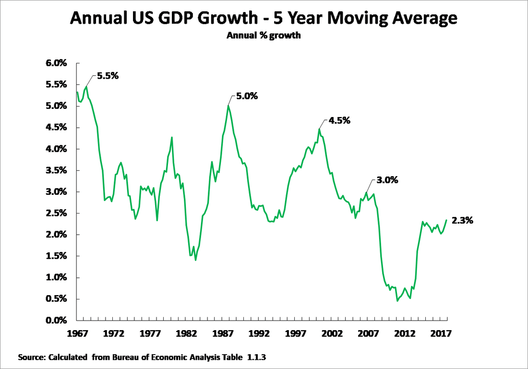
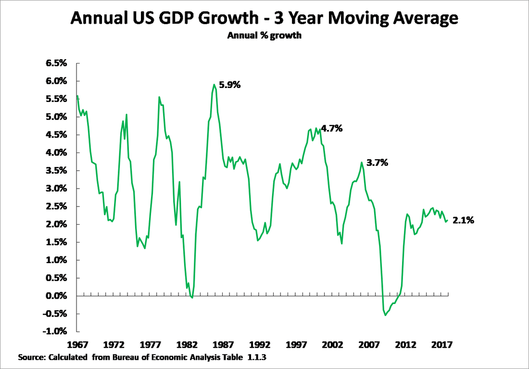
Turning from long-term to US medium-term growth, this necessarily shows greater fluctuations than US long term growth – as medium term growth rate is affected by business cycles. It is therefore useful, in analysing such cyclical fluctuations, to consider not only the average trend but also to make a comparison of successive peaks and troughs of business cycles. To illustrate these a five-year moving average for US growth is shown in Figure 4 and a three-year average is shown in Figure 5.
• Taking a five-year average, and considering the maximum growth rate in business cycles, the US economy slowed from 5.5% in 1968, to 5.0% in 1987, to 4.5% in 2000, to 3.0% in 2006, to 2.3% in the 4th quarter of 2017.
• Taking a three-year average, the US economy slowed from 5.9% in 1985, to 4.7% in 1999, to 3.7% in 2006, to 2.1% in the 4th quarter of 2017.
Therefore, the long-term tendency of the US economy to slow down is again clear. The trend of the peak growth rates in US business cycles falling over time is precisely in line with the long-term slowing of the US economy.
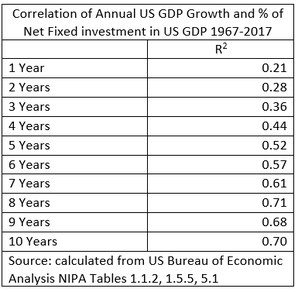
Having shown the factual trends in US economic growth it is then necessary analyse what produces them. My article ‘Trump’s Tax Cut – Short Term Gain, Long Term Pain for the US Economy‘ analysed in detail that statistically the strongest factor determining US medium/long term growth is US net fixed investment (i.e. US gross fixed capital formation minus capital depreciation). Table 2 updates the data regarding this given in the earlier article to now include 2017.As may be seen, over the short-term there is no strong correlation between US GDP growth and the percentage of net fixed investment in US GDP – the R squared correlation for 1 year is only 0.21. Indeed, as ‘Trump’s Tax Cut – Short Term Gain, Long Term Pain for the US Economy’ showed in detail, there is no structural factor in the US economy which is strongly correlated with US growth in the purely short term. That is, put in other terms, numerous factors (position of the economy in the business cycle, trade, situation of the global economy, weather etc) determine short term US growth. However, as medium and long-term periods are considered, the correlation of US GDP growth with the percentage of net fixed investment in US GDP becomes stronger and stronger. Already over a five-year period the level of net fixed investment in US GDP explains the majority of US GDP growth, and over an eight-year period the R squared correlation is 0.71 – extremely strong.
It is unnecessary for present purposes to establish the direction of causality in this relation. The extremely strong correlation between US GDP growth and the percentage of net fixed investment in US GDP simply means that over the medium/long term it is not possible for the US economy to acclerate without the percentage of US net fixed investment in GDP increasing. This equally means that analysing the percentage of US net fixed investment in US GDP allows the potential for the US to accelerate its medium/long term growth to be determined. This also means that to assess Trump’s possibility to increase US medium/long term growth it is necessary to analyse trends in US fixed investment.
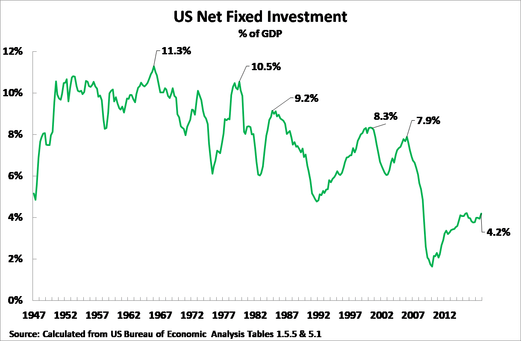
Turning to analysis of these factual trends, Figure 6 illustrates the percentage of net fixed investment in US GDP – showing the extremely sharp fall in this which has occurred. This fall corresponds to the long-term slowdown in US growth already analysed.
To be precise, taking peak levels in business cycles:
- In 1966, in the middle of the long-post World War II boom, US net fixed investment was 11.3% of US GDP;
- In 1978 US net fixed investment was 10.5% of US GDP;
- In 1984 US net fixed investment was 9.2% of US GDP;
- In 1999 US net fixed investment was 8.3% of US GDP;
- In 2006 US net fixed investment was 7.9% of US GDP;
- In the 4th quarter of 2017 US net fixed investment was 4.2% of US GDP.
It is therefore clear that while there has been some recovery of US net fixed investment since the extreme depth of the international financial crisis, US net fixed capital formation remains not only far below post war peak rates but even well below pre-international financial crisis levels. Due to this very strong medium/long term correlation between US net fixed investment and US GDP growth US economic growth cannot accelerate over the medium/long term without an increase if the percentage of US net fixed investment in GDP. Furthermore, it is clear that no such increase in the percentage of US fixed investment in GDP has taken place. Therefore, there is at present no basis for an acceleration in US medium/long term GDP growth.
- Nothing has yet occurred which would indicate or permit an acceleration in medium/long term US growth from its present level of slightly above two percent.
- The US is undergoing a normal cyclical recovery after its extremely poor performance of only 1.5% growth in 2016. Furthermore, in order to maintain the US long-term average growth rate, and counterbalance an extremely poor performance in 2016 and only slightly above average growth of 2.3% in 2017 as a whole, US GDP growth in 2018 would be expected to be above its long-term average – the effect of the Trump tax cut would be expected to sustain this short term increase. This trend however would not, unless the level of growth reached was extremely high, represent a break with the medium/long term slow growth of the US economy.
It is of course important to follow and check these trends factually given the importance of the US for the global economy and for China. Given the determinants of US economic performance over the medium/long term it follows that, in addition to factually registering US growth, it is necessary to regularly analyse the percentage of net fixed investment in US GDP in order to see if any new conditions for an acceleration of US medium-long term growth is occurring – so far it has not.
It should also be noted that the Trump tax cut, because it is not matched by government spending reductions, will sharply increase the US budget deficit and therefore, other things remaining equal, it will reduce US domestic savings, and therefore reduce the domestic US capacity to finance investment.
The following dynamic should therefore be anticipated in the US economy, which China’s policy needs to take into account:
- In 2018 continued cyclical upturn in the US economy.
- Due to the factors that would permit an upturn in US medium/long term growth not being present this cyclical upturn in 2018 will not turn into a much stronger upturn in 2019-2020 but on the contrary medium/long term factors slowing US growth may reduce growth from its likely 2018 level.
- As the problem in the US economy is lack of net fixed investment, that is in expansion of the US capital stock, the form of these factors slowing the US economy after its 2018 recovery are likely to be symptoms of capacity constraints and overheating – i.e. increases in US interest rates and in inflation. This upturn in US interest rates is already clear, with the yield (interest rate) on US 10-year Treasury Bonds rising significantly from 1.86% when Trump was elected to reach 2.84% on 2 February.
Finally, while the focus of this article is economic, it is clear certain geopolitical conclusions flow from these factual trends in the US economy.
- The inability of the US, with its present level of net fixed investment, to increase its medium/long term economic growth means that those in the US who advocate a ‘zero-sum game’ approach to US-China relations (‘neo-cons’ and ‘economic nationalists’) cannot achieve their goal of strengthening the position of the US compared to China by fundamentally accelerating the US economy. Their only practical policy option, therefore, is to attempt to slow China’s economy. This may possibly not be clear during 2018, when the US is undergoing a normal cyclical upturn, but it will become clear later as medium/long term US growth fails to accelerate.
- The reduction in US domestic saving caused by the current tax cut means that US sources of financing fixed investment, other things remaining equal, will be reduced. This will increase pressures on the US to attempt to maintain its level of fixed investment through increased foreign borrowing – as in principle US fixed investment can be financed from foreign as well as domestic sources. However, as the US current account of the balance of payments is necessarily equal to US capital inflows with the sign reversed, this means that if the US undertakes increased foreign borrowing its balance of payments deficit will increase – which goes in the direct opposite direction to Trump’s pledge to reduce the US trade deficit.
- If, however, the US does not engage in extra foreign borrowing then the reduction in US domestic saving which will result from the Trump tax cut would put downward pressure on US fixed investment – making it more difficult to achieve the US goal of increasing its medium/long term growth rate.
- Therefore, given the US tax cut, the US is faced either with the choice of increasing foreign borrowing, which would go against President Trump’s pledge to reduce the US trade deficit, or to reject increased foreign borrowing – in which case, because of the reduction in US domestic savings due to the tax cut, downward pressure on US fixed investment would be created. This would, in turn, put downward pressure on US economic growth.
The consequences of this is that given the tax cut will be seen, after the normal cyclical recovery in 2018, not to achieve its goal of boosting US growth this is likely to lead to US neo-cons/economic nationalists falsely accusing other countries of creating the problems which have prevented US medium/long term growth accelerating. This may lead to such forces increasing their pressure for protectionist measures in the US.


