US growth in the 2nd quarter of 2017
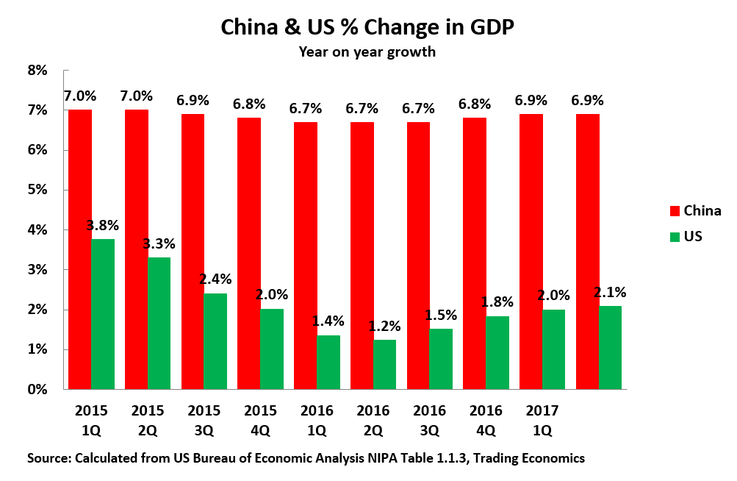
US GDP growth in the year to the 2nd quarter of 2017 was 2.1% – a very slight increase from 2.0% in the year to the 1st quarter. Figure 1 compares this to China’s 6.9% growth in the same period. China’s economy was growing more than three times as fast as the US.
This year on year US growth is a much more reliable indicator of US economic performance than the comparison between annualised US growth in the 1st quarter and the 2nd quarter because it is known, including to the US statistical authorities, that that their seasonal adjustment for the 1st quarter of each year systematically underestimates growth – an error they have not yet succeeded in correcting.
Making a comparison of the latest data to the beginning of 2015, the peak of the recent US growth cycle, it may be seen that China’s economy has slowed very marginally, from 7.0% to 6.9%, while the US economy has slowed significantly – from 3.8% to 2.1%. Therefore, the claim in Bloomberg and other sections of the Western media that in the last period the US was undergoing ‘strong recovery’, while China faced the threat of a ‘hard landing’, was the opposite of the truth. Not only was China growing more than three times as fast as the US but China’s economy scarcely slowed while the US decelerated substantially.
Within this overall framework of slow US growth, and much faster growth in China, it may however be noted that that the latest data shows some US recovery from the extremely depressed growth of 1.2% in the 2nd quarter of 2016.
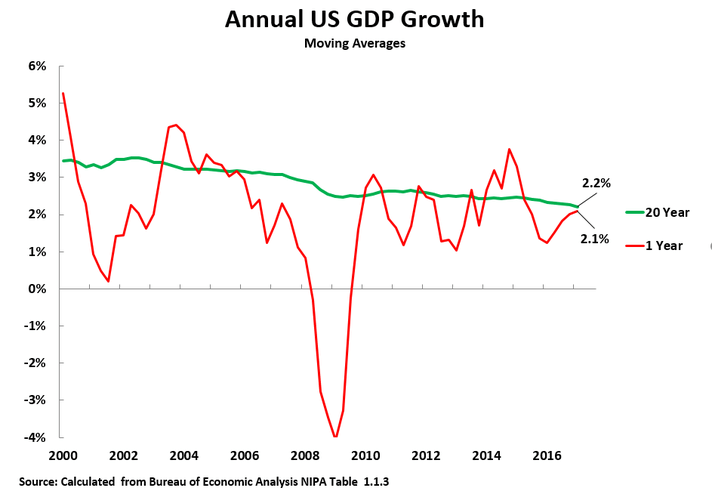
However, to assess the significance of the latest US data it is necessary to bear in mind that market economies are inherently cyclical. It is therefore necessary, to avoid exaggerating or underestimating growth, to separate long term trends from purely short-term cyclical fluctuations. This may be done by taking a sufficiently long-term average that it smooths out business cycle fluctuations – the economy will then be seen to show cyclical fluctuations above and below this long-term average. Figure 2 therefore shows the latest US annual GDP increase of 2.1% compared to its 20-year moving annual average of 2.2%. A five-year moving average shows an extremely similar annual average 2.1% growth. In summary, US long term average growth is approximately slightly above two percent – US statistical forecasters, and the IMF, give projected close rates closer to two percent.
Compared to this long-term US average growth Figure 2 shows in 2016 US growth was significantly below its long-term average – the US was undergoing a cyclical slowing. In 2017 it would therefore be expected, purely for business cycle reasons, that the US economy would grow at or faster than its long-term average – in order to compensate for very slow growth in 2016.
The slight speeding up of the US economy in the 2nd quarter of 2017, compared to the depressed level in 2016, which shows this trend is therefore a normal cyclical movement and not an indication of acceleration of the fundamental US growth rate. President Trump may, therefore, want to claim credit for some recovery of the US economy, but in fact this is a purely statistical process and not a serious acceleration.
To summarise, the latest US data shows a normal process of recovery from very depressed growth levels in 2016, but no acceleration from a US basic long-term growth rate of at or slightly above two percent.
Comparison to predictions
Turning to the test of analyses of the US economy against these facts, this is of considerable practical importance as an accurate analysis of prospects for the US economy is crucially important for China both economically and geopolitically, However, until recently three factors produced estimates in some circles in China for likely estimates of US growth which proved to be inaccurate because they were far too high:
- As already noted, some Western media outlets projected stories of a ‘strong US recovery’ when in fact the data shows this was not occurring – that is, such media were engaging in propaganda not factual analysis.
- As will be analysed below, leading Western institutions, in particular the IMF, made systematic errors in projecting too high US growth rates.
The first of these factors has already been dealt with, therefore here the second factor, misanalysis by the IMF, will be dealt with.
Errors in IMF projections
It is easy to factually establish that over a prolonged period the IMF made systematically overoptimistic projections for the US economy – in technical terms the IMF had an ‘optimism bias’ regarding the US economy.
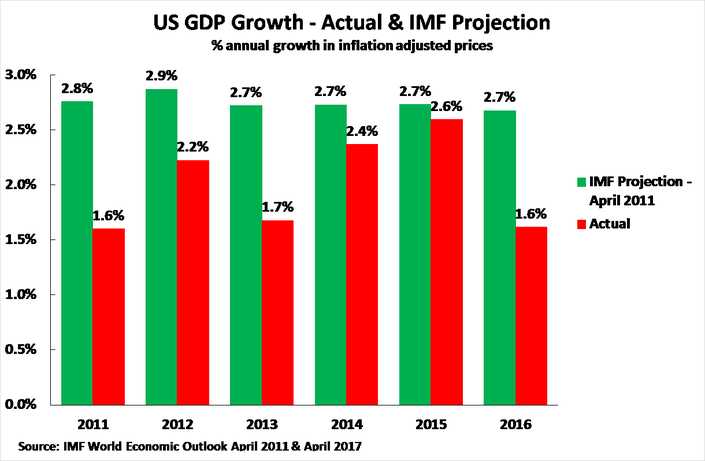
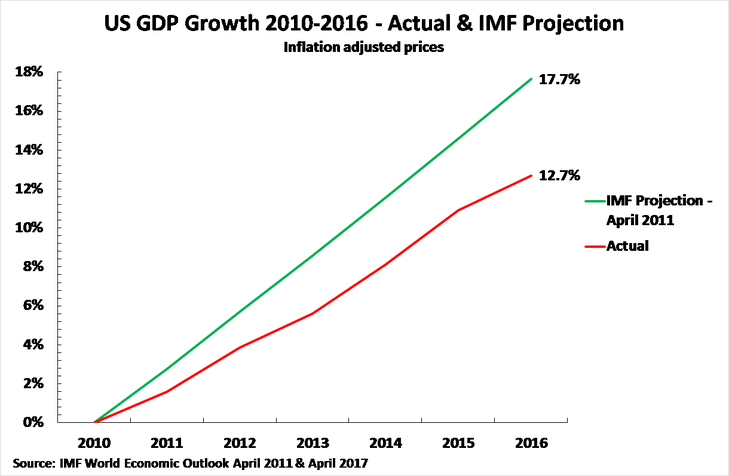
The IMF publishes twice a year five-year projections for countries. To compare these forecasts to actual growth the latest available annual growth data for the US is for 2016. Figure 3 therefore shows the projections made by the IMF for the US economy in April 2011, the earliest year in which it made a forecast for 2016, compared to actual US growth. It may be seen that for every single year the IMF predicted higher US growth than actually occurred – the annual exaggeration in the growth projections being up to 1.2%.
While at least some errors are inevitable, in a well-constructed economic model errors should be random – that is, projected growth should be sometimes above the actual rate and sometimes below. However, if the differences between projection and reality are always in the same direction there is a systematic bias in the model – that is, the IMF model was biased to systematically exaggerate prospects for US growth.
To be fair it should be stated that the IMF has recently corrected its estimates by sharply revising downwards projections for US growth – in its latest World Economic Outlook the IMF projects annual average US growth at 2.0% from 2016-2022, approximately in line with current factual trends. It was however extremely unacceptable that for a prolonged period the IMF had systematically too optimistic projections for the US economy – this did not correspond to the method of ‘seek truth from facts’. It was also a serious error that some circles in China, including in universities and research organisations, accepted such projections without checking them against actual data.
ConclusionBecause of the importance of correct estimates of developments in the US economy for China the present author has devoted considerable attention to seeking to correct the exaggerations of US growth potential which existed in some circles in China. The actual situation of the US economy is:
• There will be a real but relatively limited upturn in the business cycle in 2017.
• This increase will not be large enough to alter the fundamental trend of slow US medium/long term growth – which will remain at approximately two percent or slightly above.
The reasons for these trends were analysed from the point of view of the theoretical economic issues in my book The Great Chess Game (一盘大棋? ——中国新命运解)析and from the point of view of factual study of the actual forces determining ‘US growth in Why the US Remains Locked in Slow Growth’ The latest US economic data is clearly in line with these analyses.
It is therefore very much to be hoped that, using the method of ‘seek truth from facts’, the latest US economic data will lead to correction of exaggerated assessments of US economic growth in some circles and lead to more accurate assessments of developments in the US economy.


